
Ansh’s weather explorer
Pick any day to see what Ansh’s backyard station measured, from hot September days to a heavy November snow.
- Station: Sep 2024 – Feb 2025
- Snow journal
- Drawing & photos
Real readings from the past. Not live.
Pick a day
Each square is one day, colored by how hot it got. Tap one to see the numbers, or jump to a record breaker.
The calendar needs JavaScript. You can download the daily readings as a spreadsheet instead.
Data lab: chart every day, compare rain, wind and more
Journal, drawing & photos
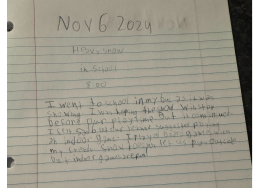
A snowy day
Heavy snow and a day of indoor games. Tap the page to read it.
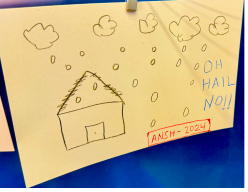
Oh hail no!
Ansh drew a hailstorm to show what he saw.
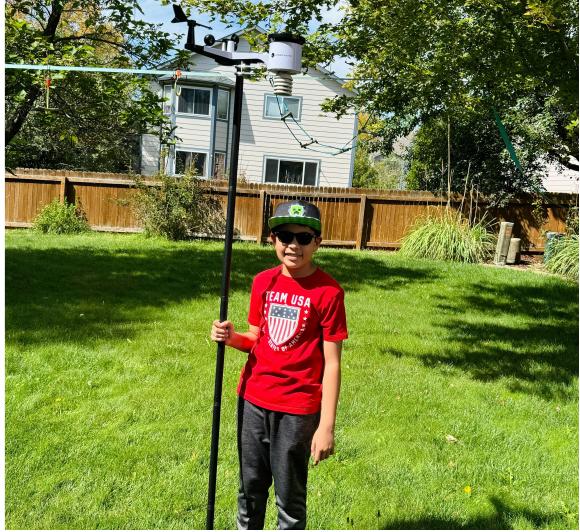
Ansh’s station
The backyard station behind every day above.
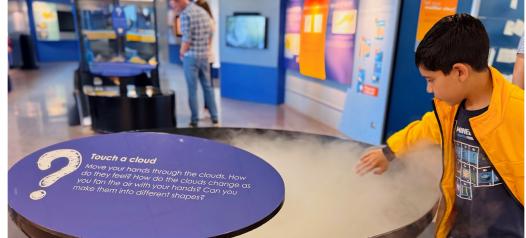
Touch a cloud
Exploring weather exhibits at the NCAR Mesa Lab Visitor Center in Colorado.
From our science poster
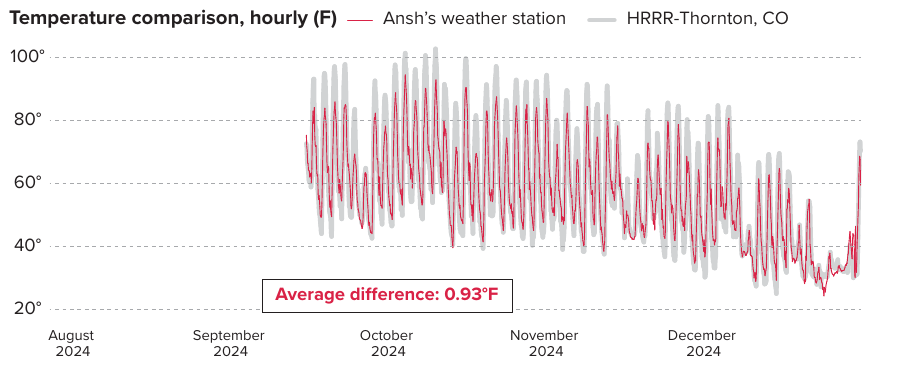
How we got these numbers
The station took a reading every 5 minutes. Each day’s high, low and average come from those readings. Days without enough readings are left blank.
Days when the station saved too few readings, or only one reading at a random time, are left blank. Live readings are not connected to this website.