
Ishika’s weather explorer
Pick any day to see what Ishika’s backyard station measured. Then read what she wrote about it.
- Station: Aug 2024 – Feb 2025
- 66 journal pages
- Drawings & photos
Real readings from the past. Not live.
Pick a day
Each square is one day, colored by how hot it got. Tap one to see the numbers, or jump to a record breaker.
The calendar needs JavaScript. You can download the daily readings as a spreadsheet instead.
Data lab: chart every day, compare rain, wind and more
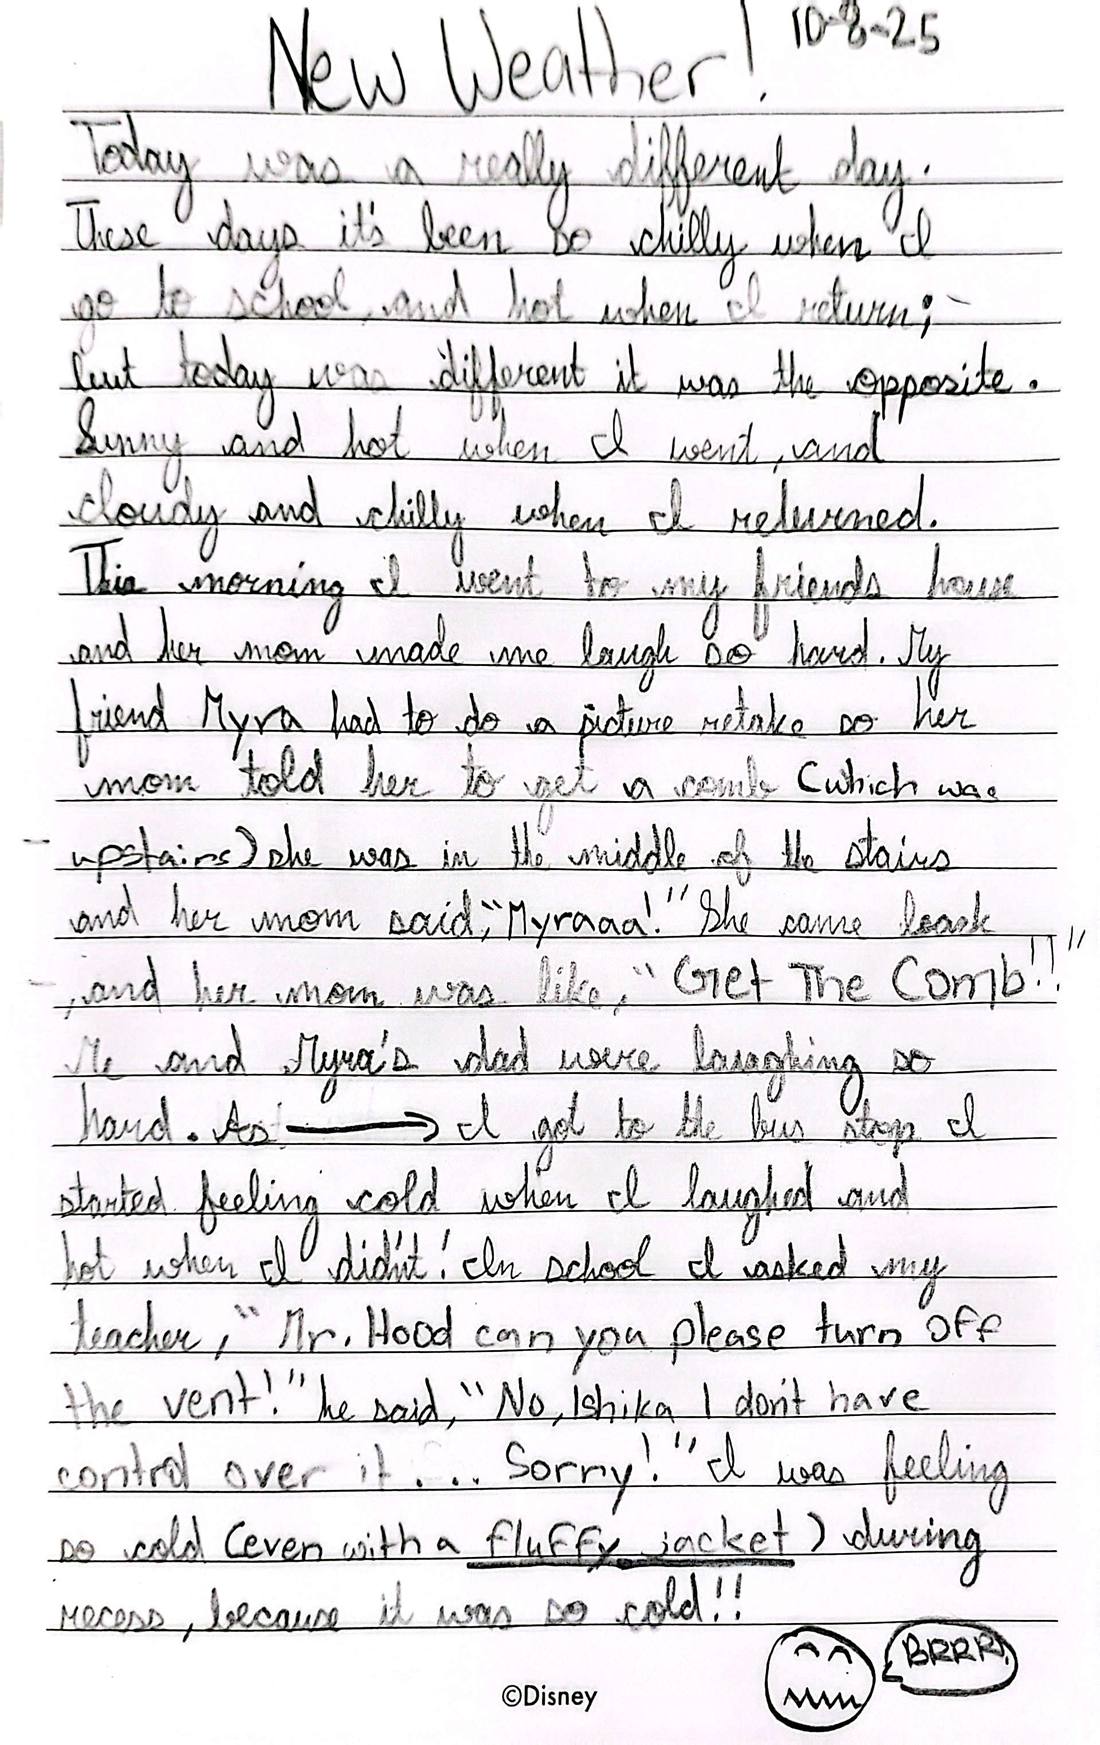
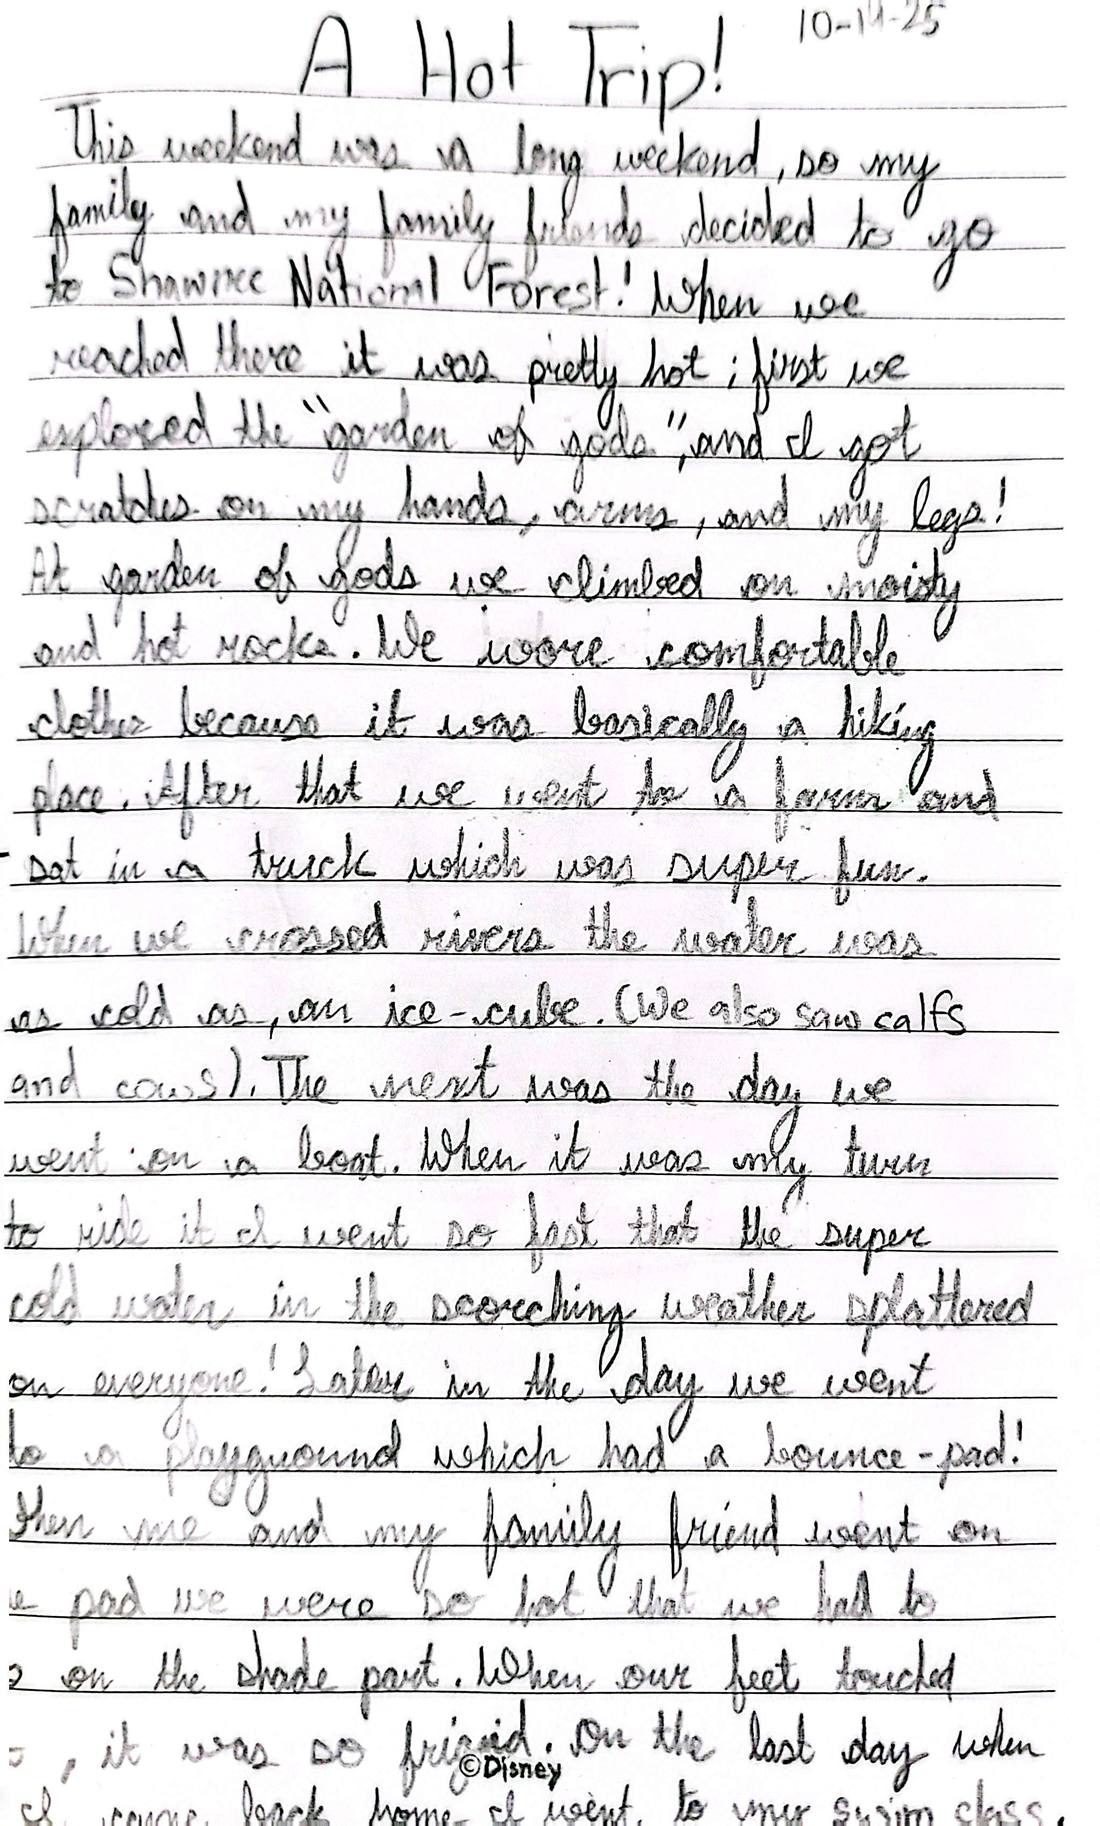
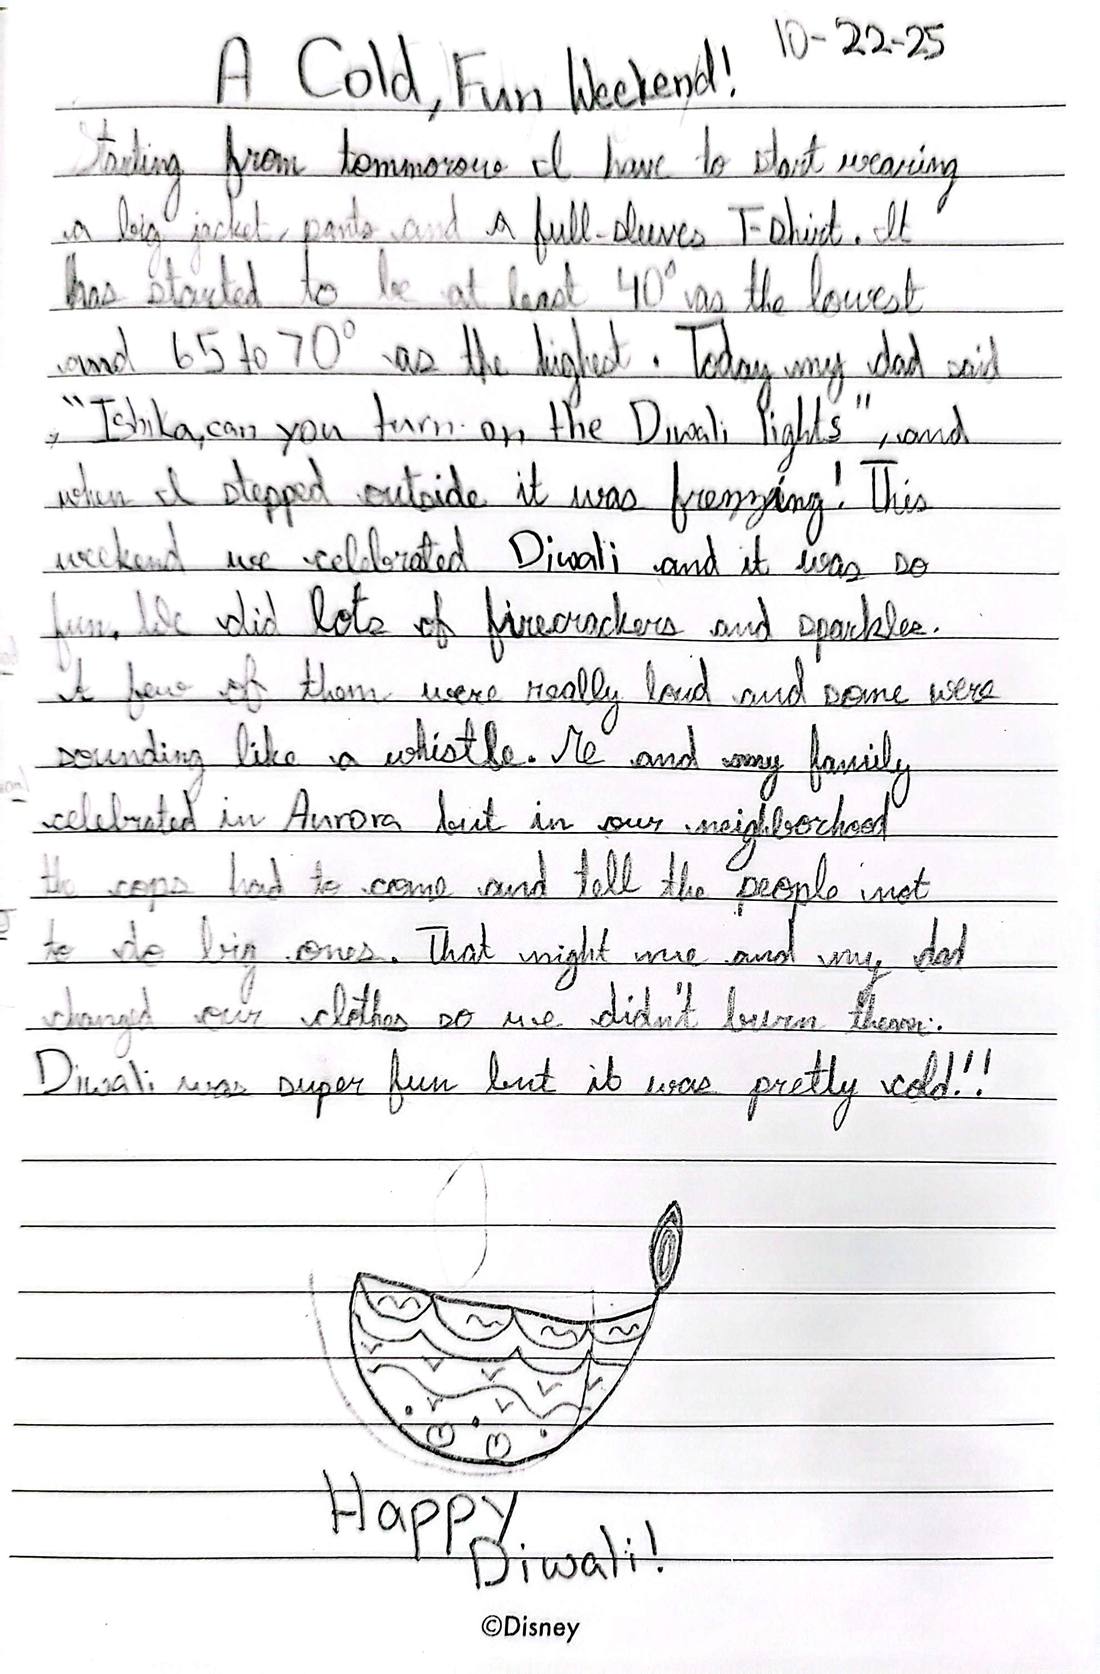
Ishika’s weather journal
One season at a time. Tap a page to read it.
Summer 2024 8 pages
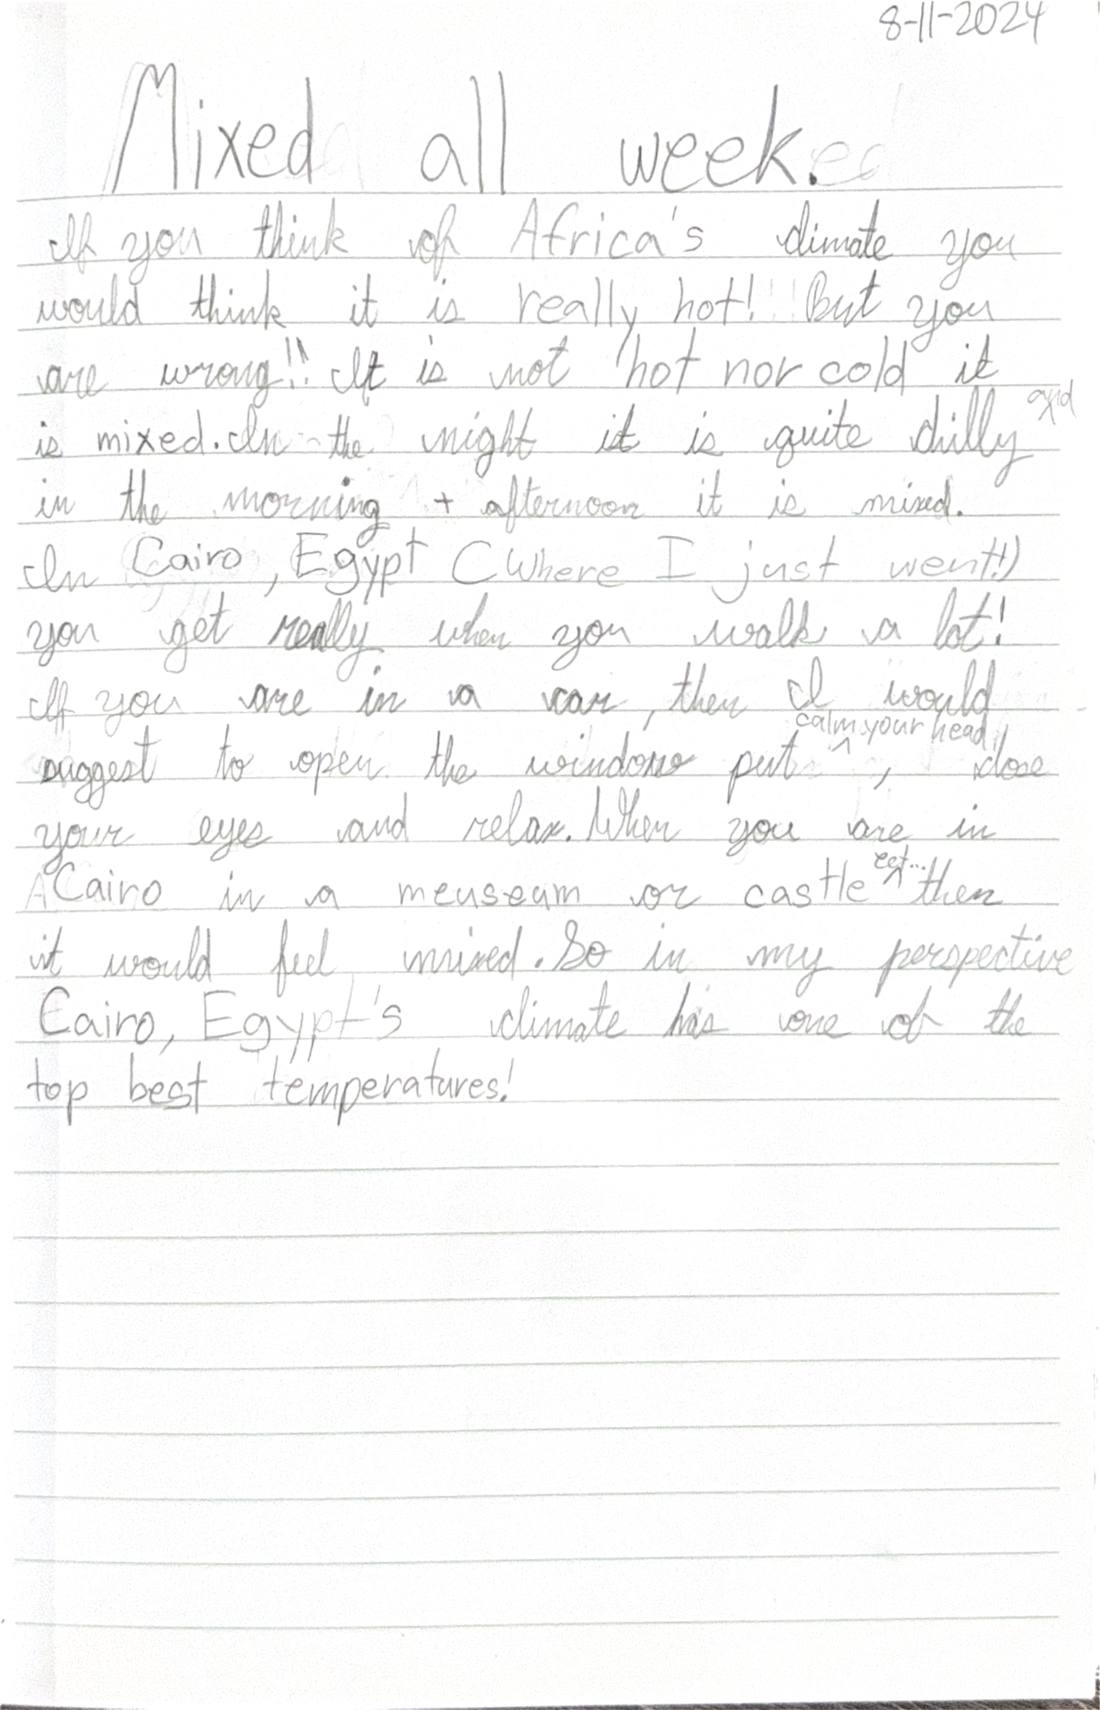
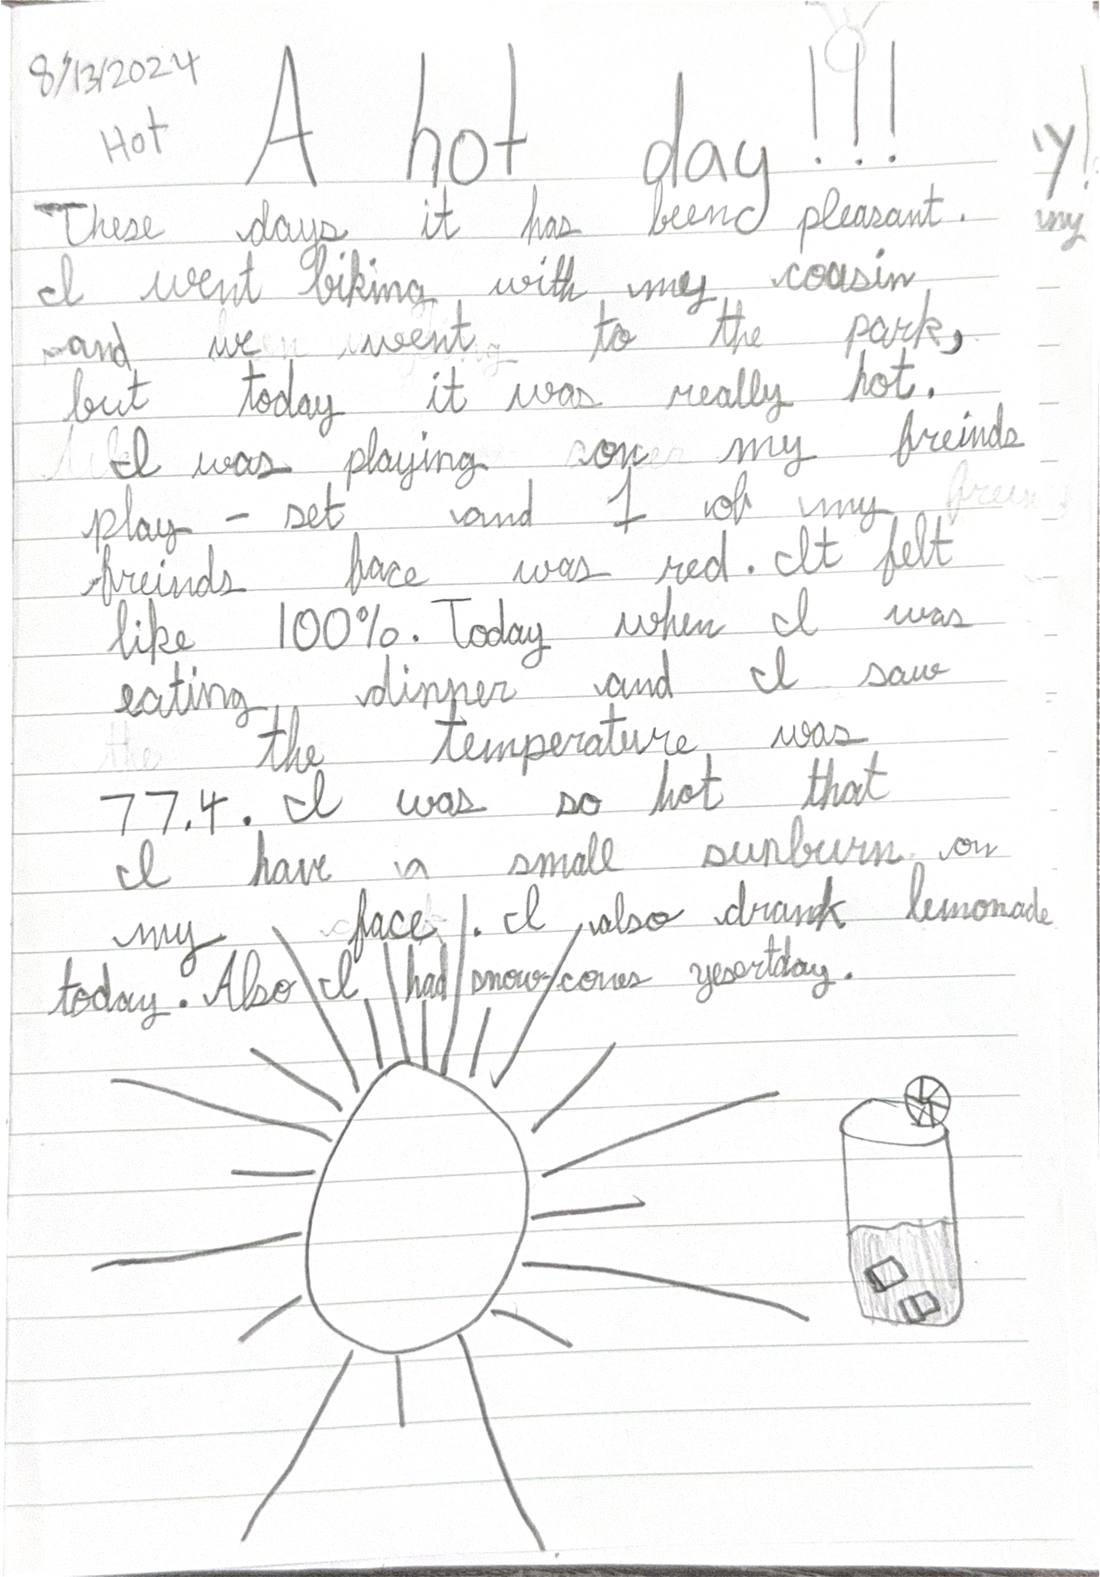
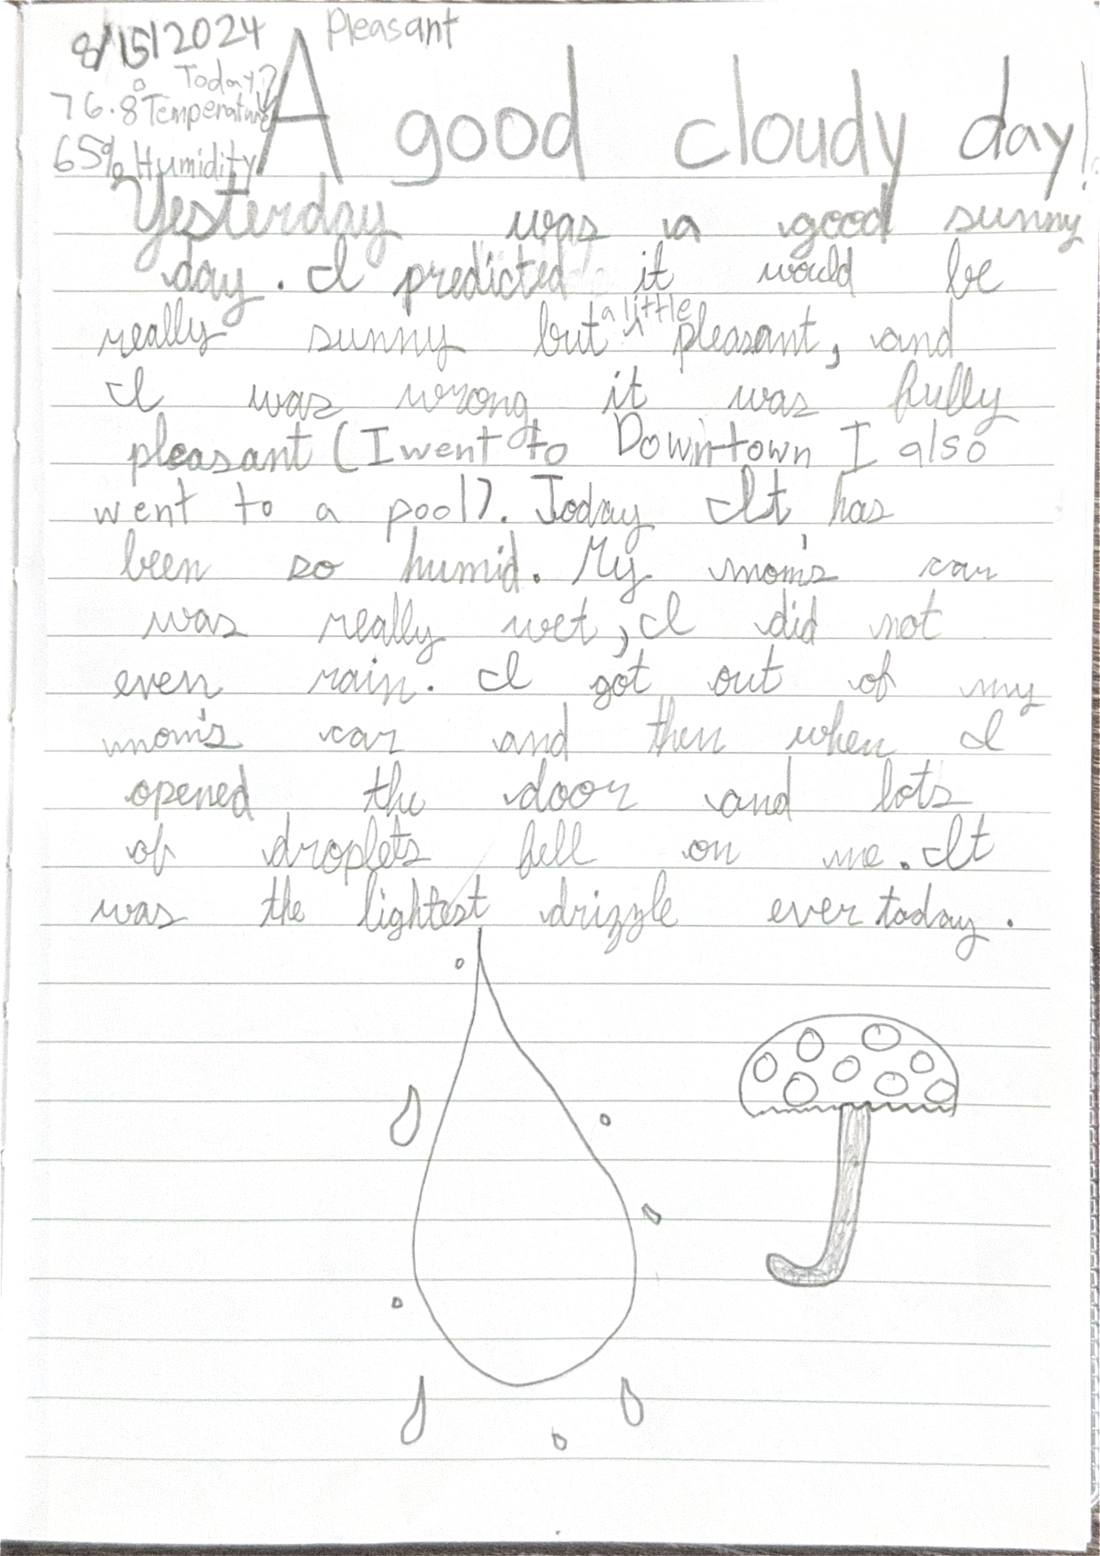
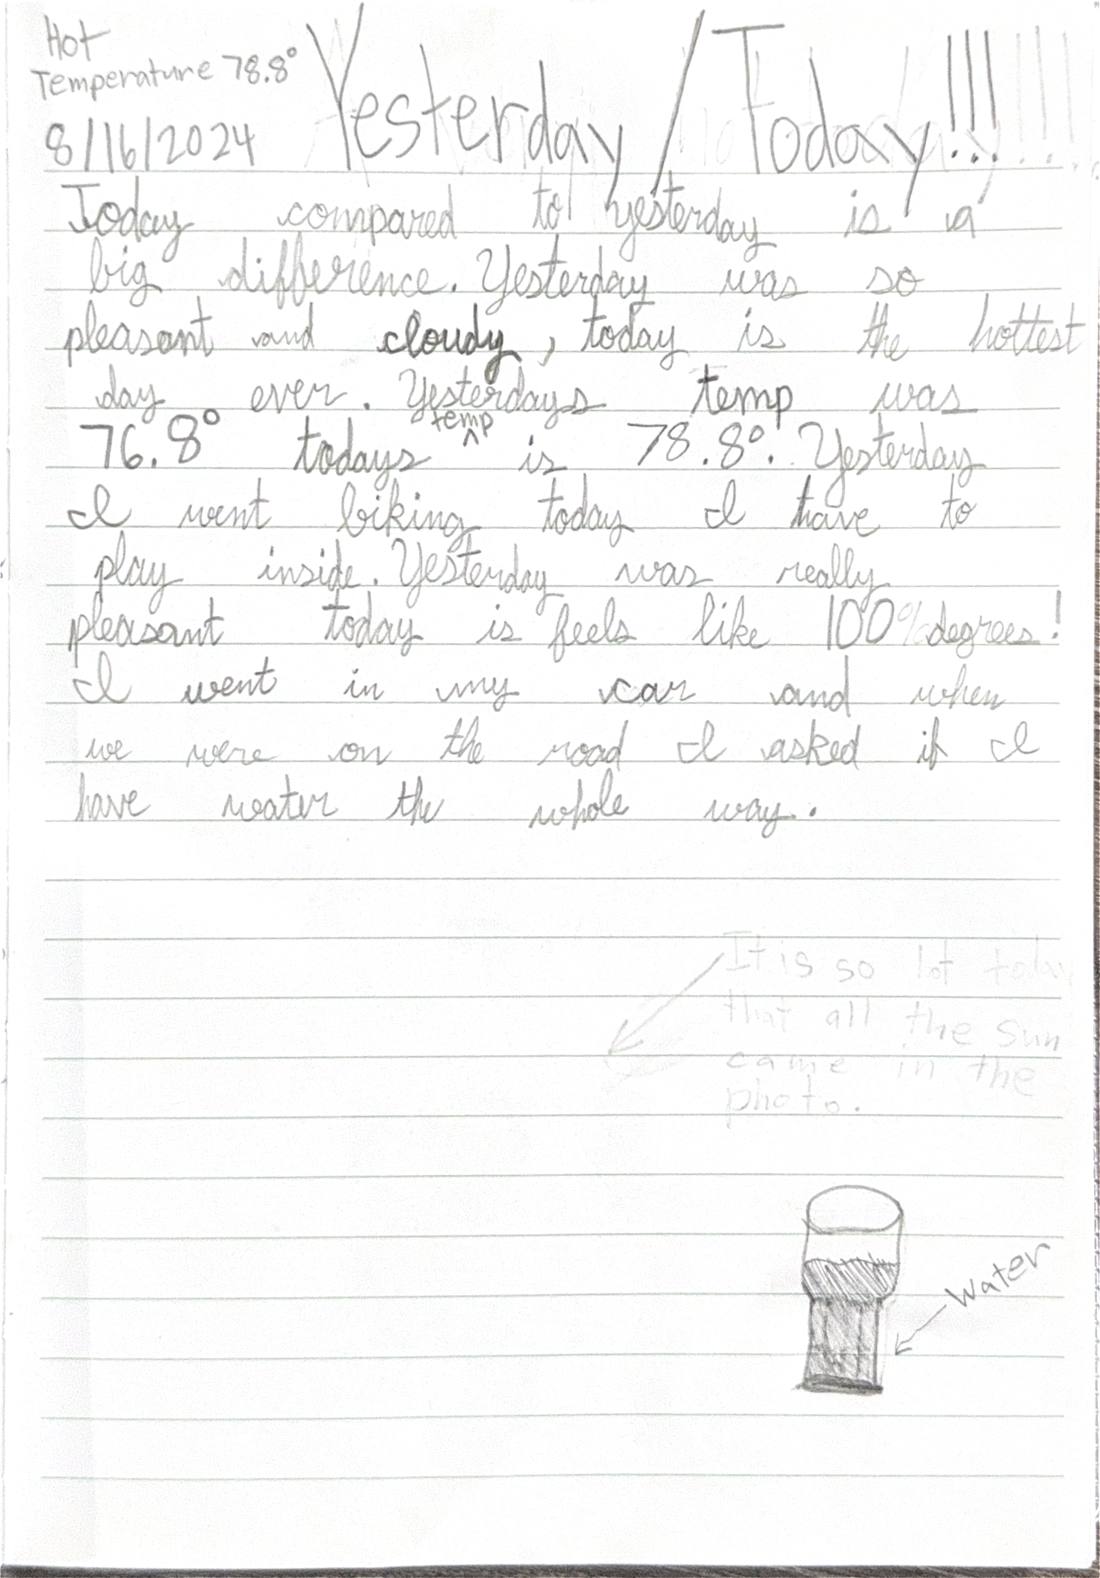
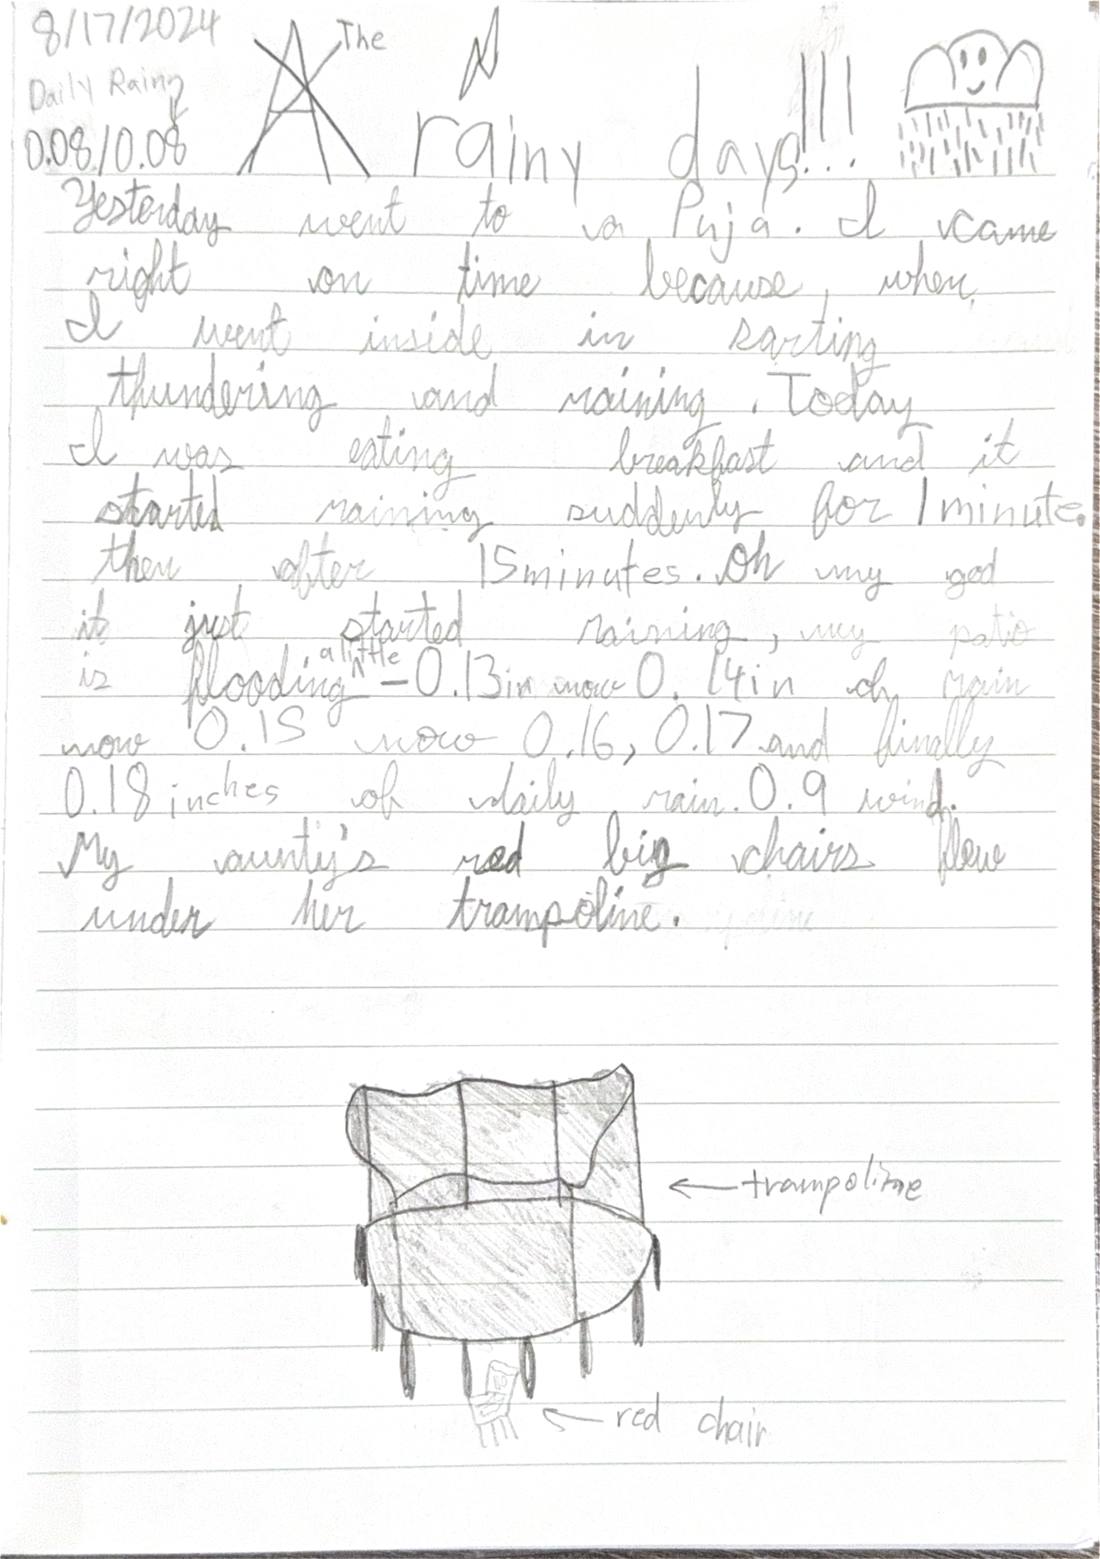
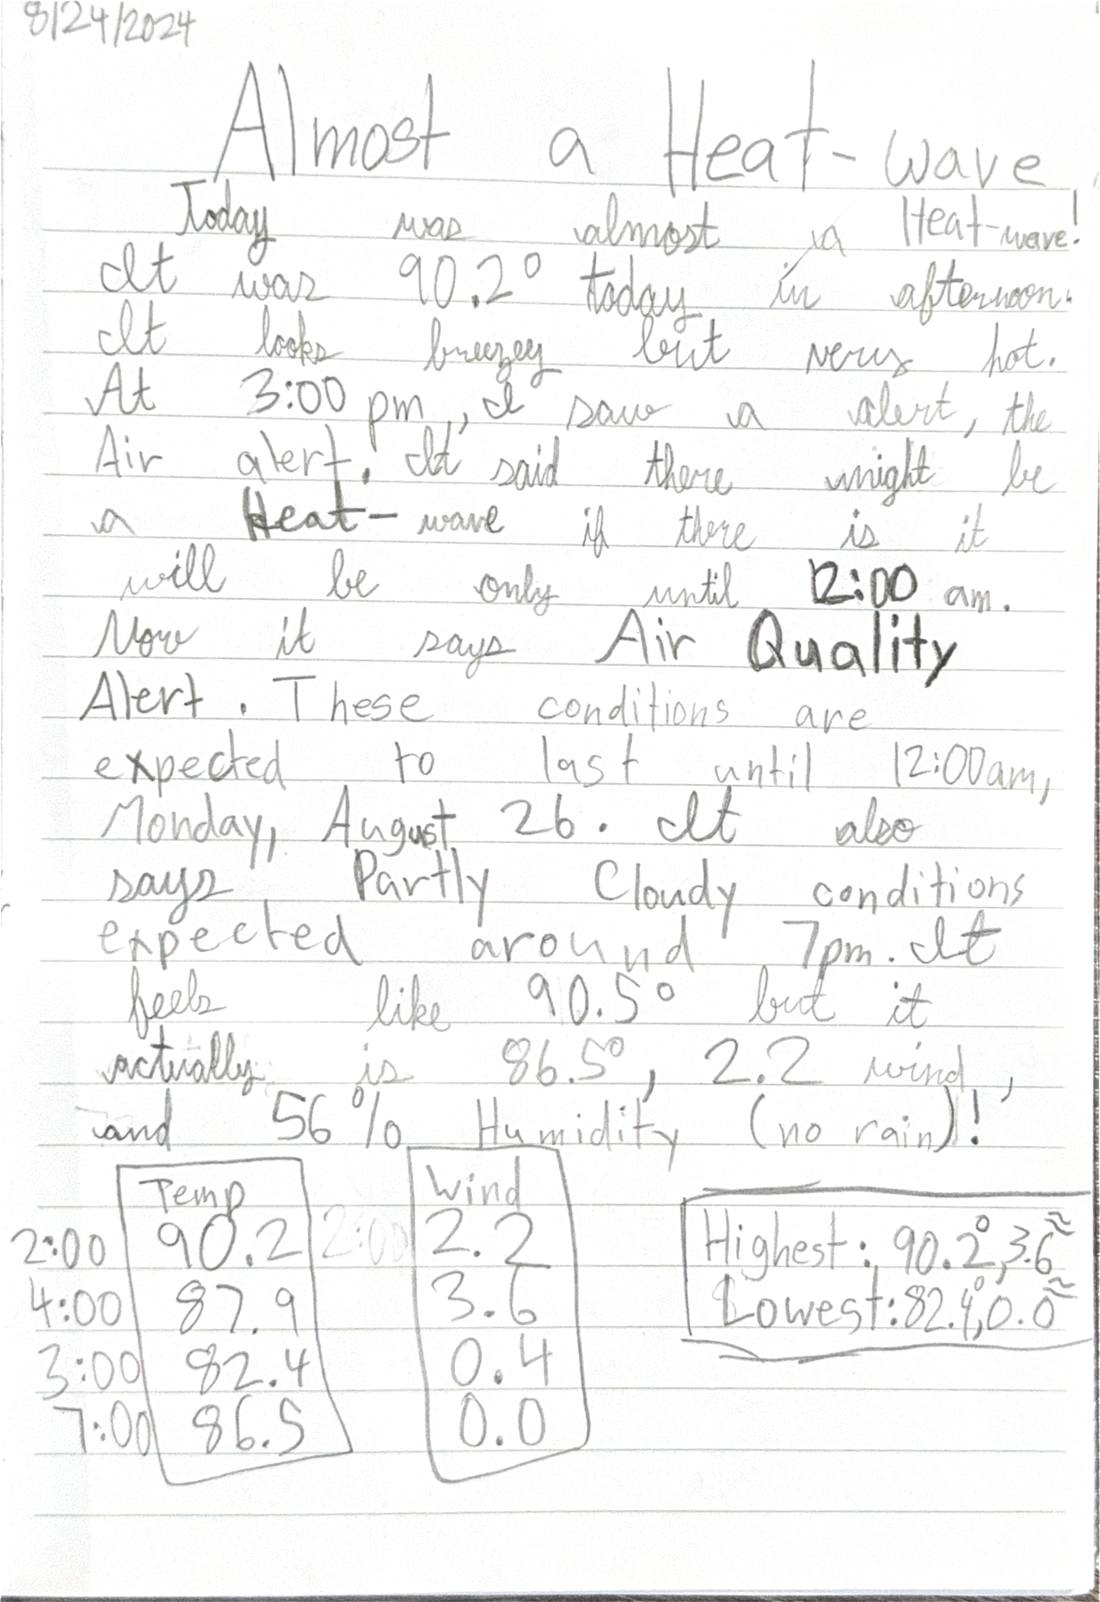
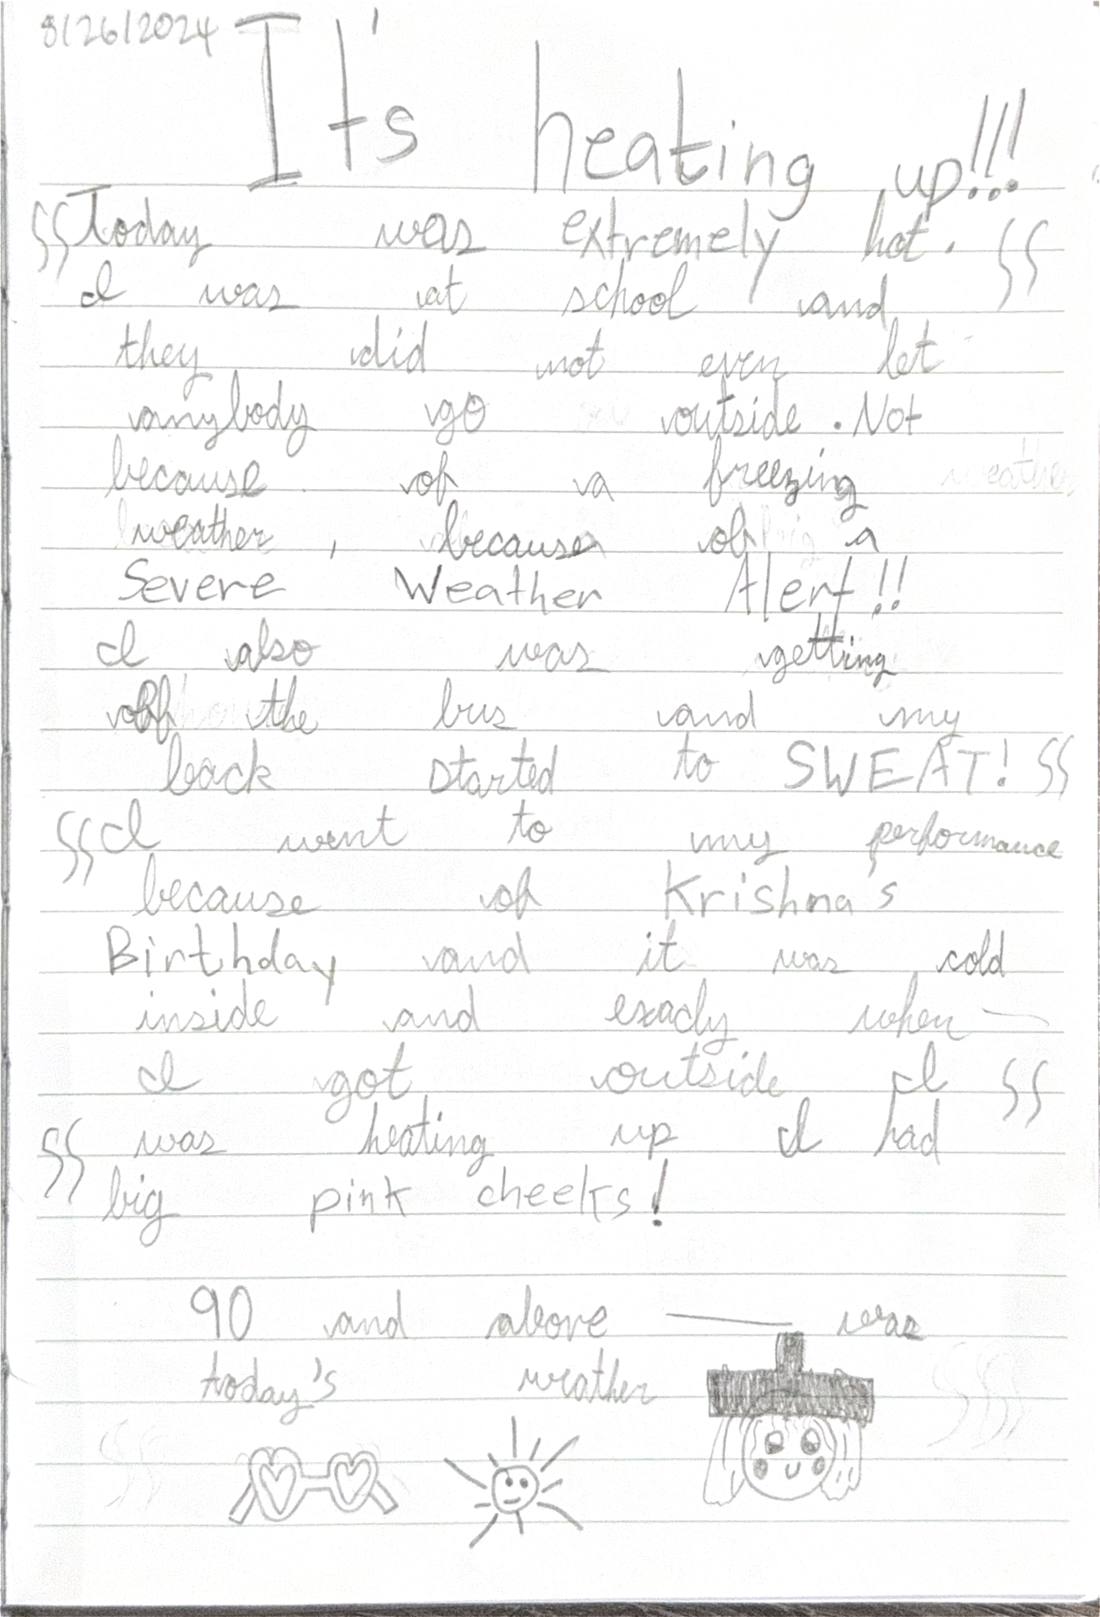
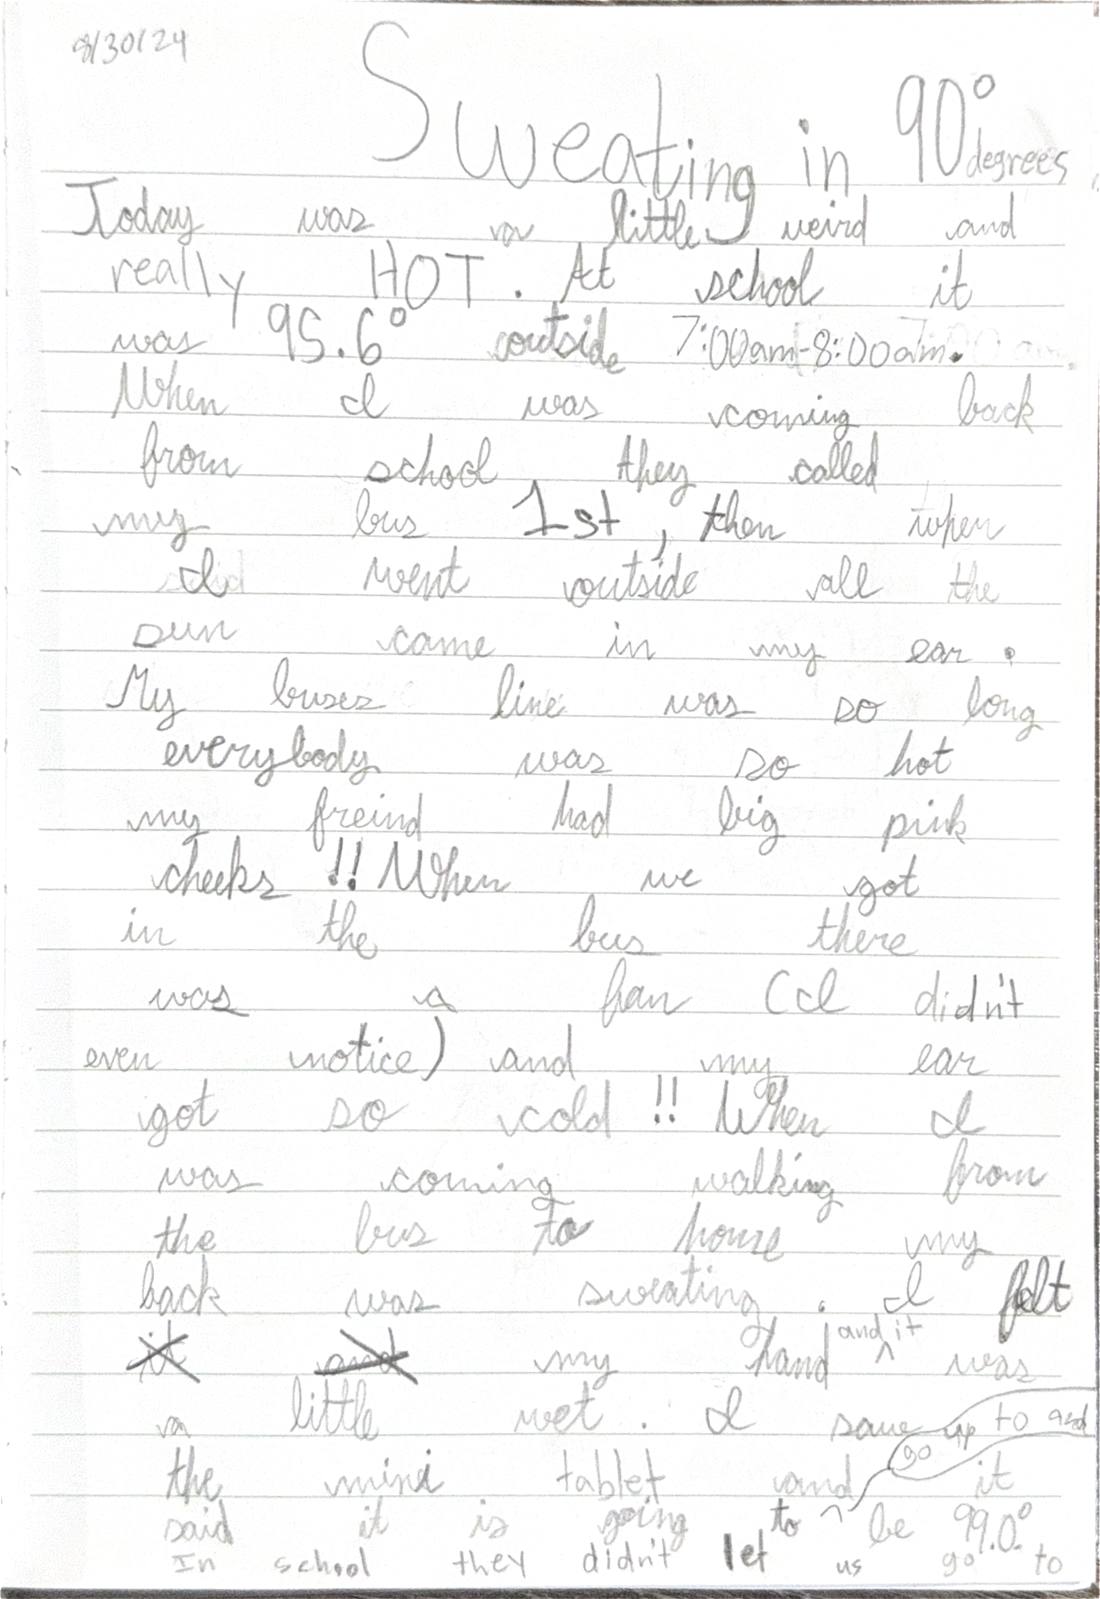
Fall 2024 13 pages
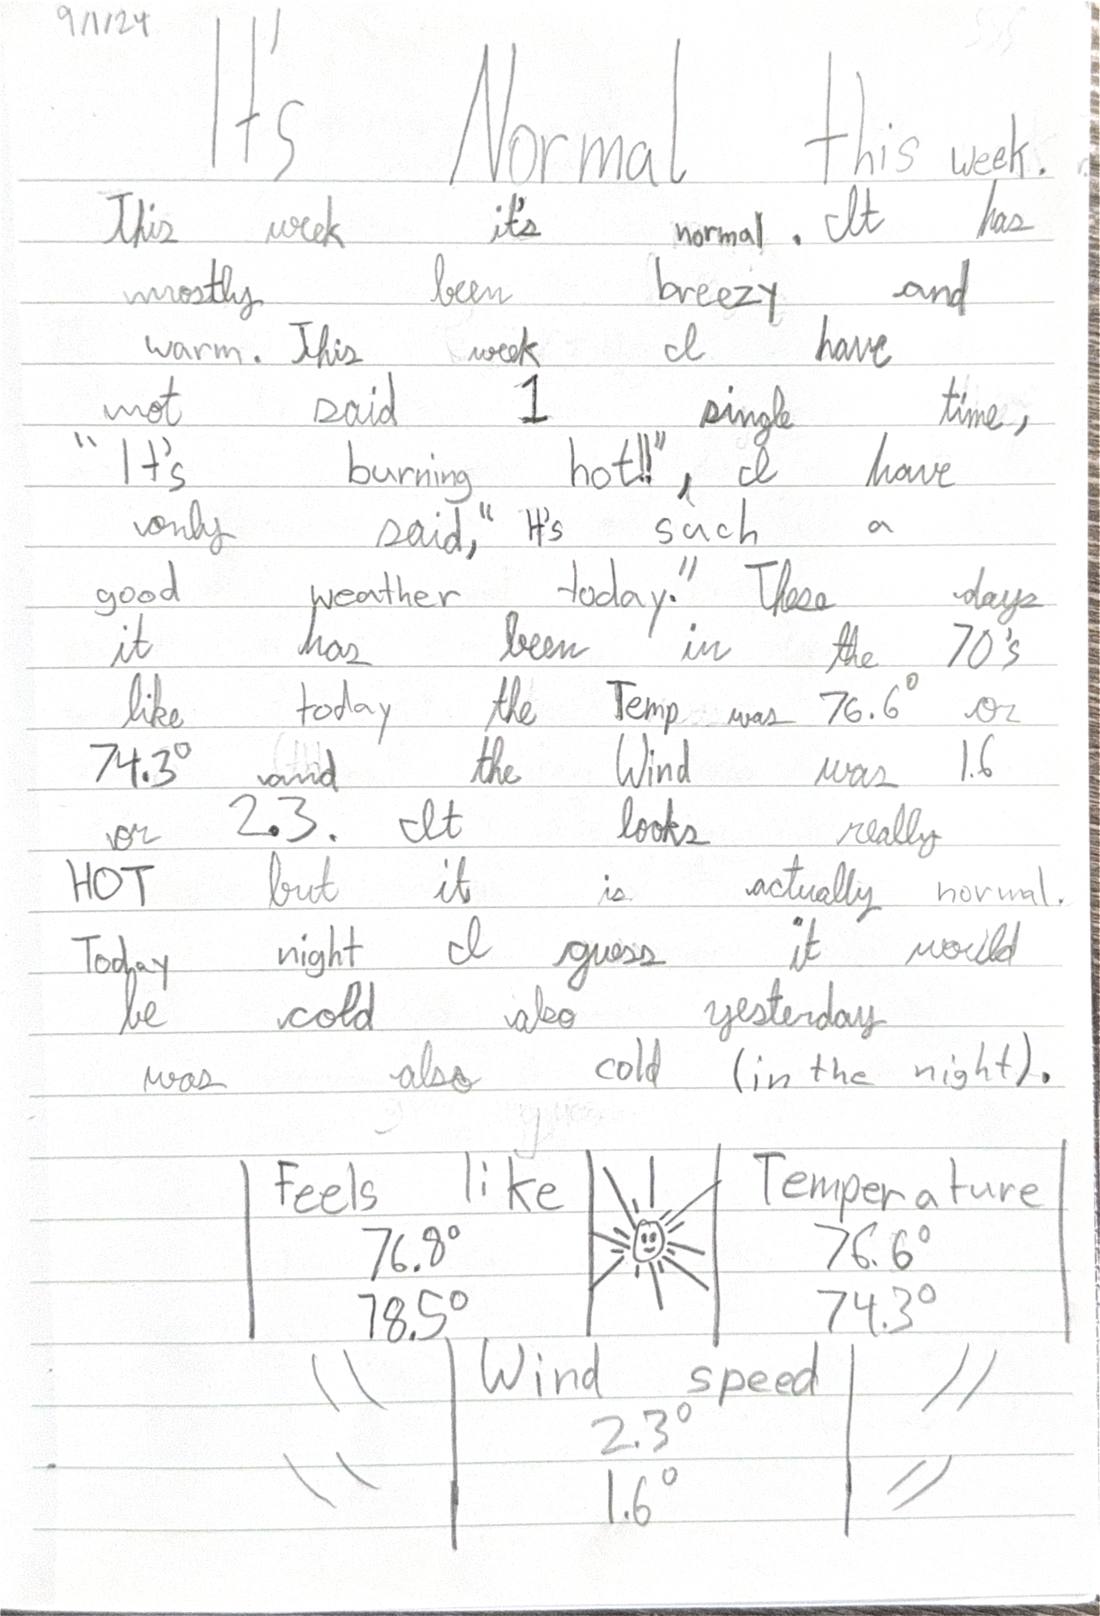
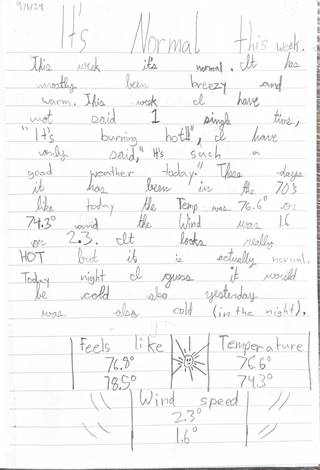 It's normal this weekSep 1, 2024
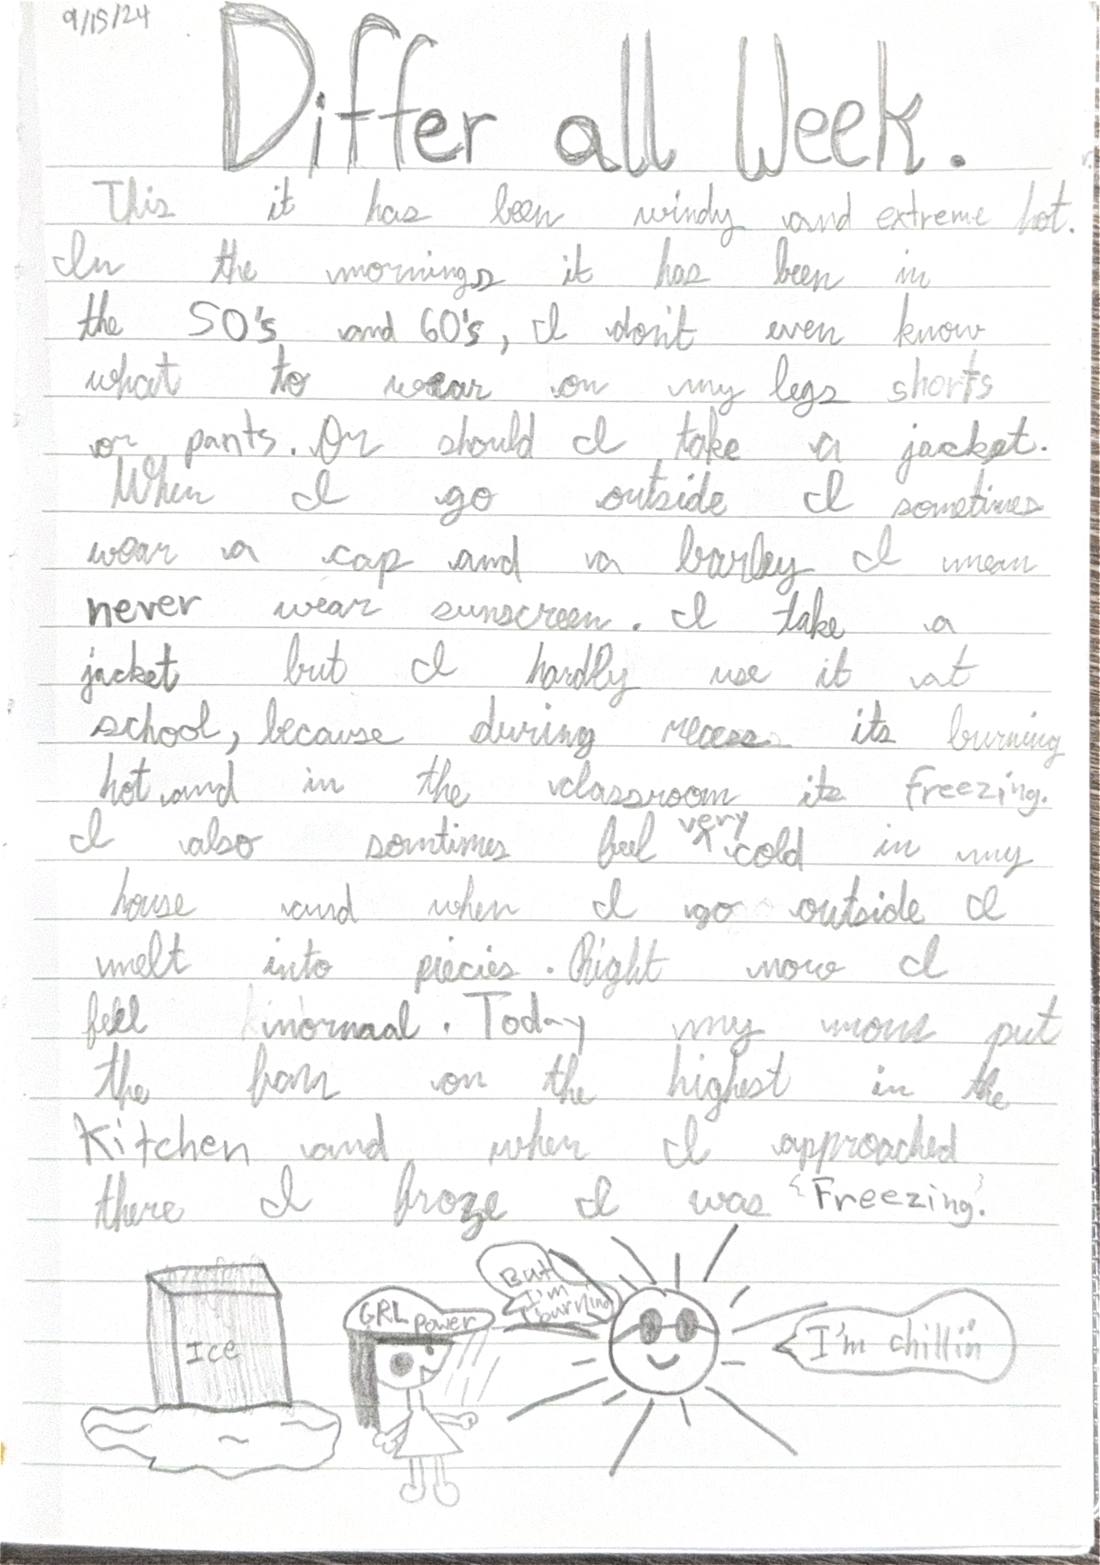
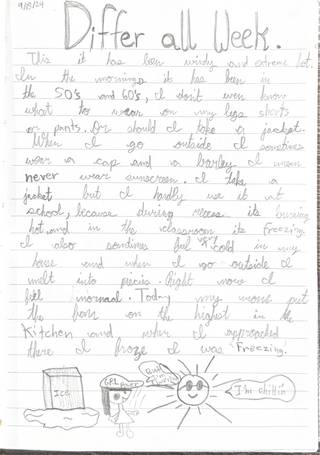 Differ all weekSep 15, 2024
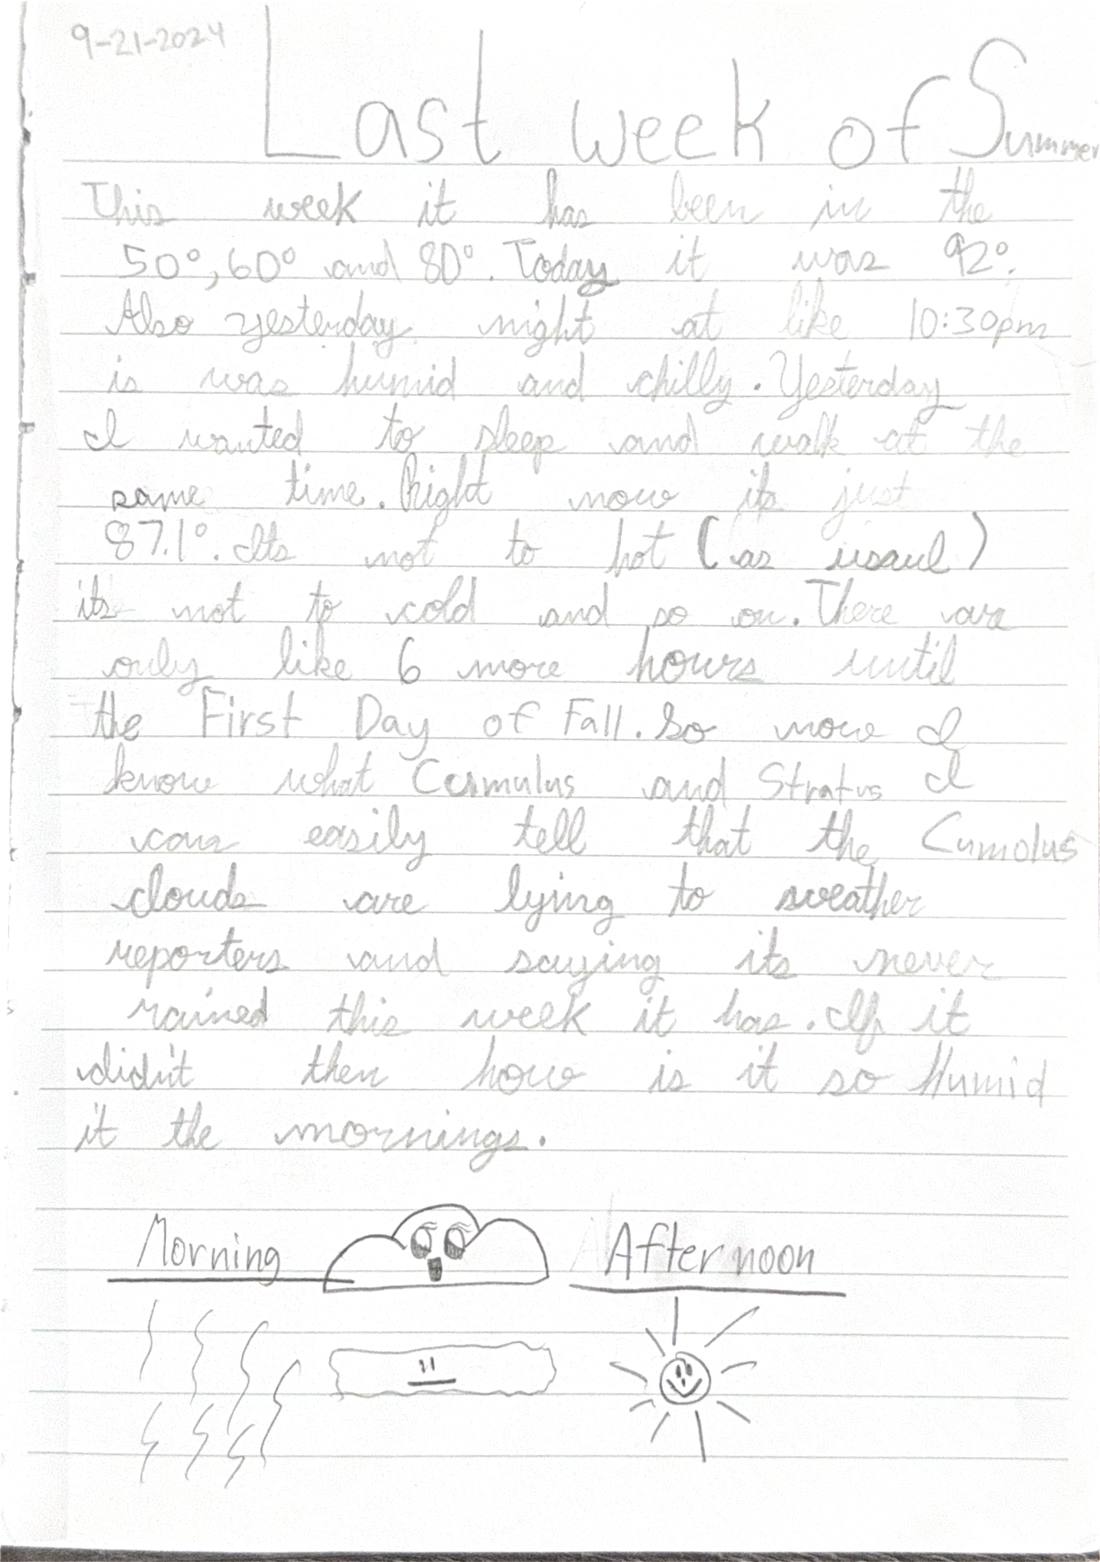
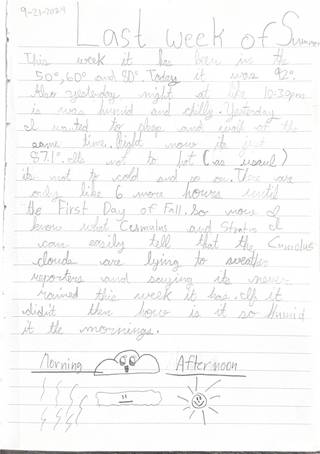 Last week of summerSep 21, 2024
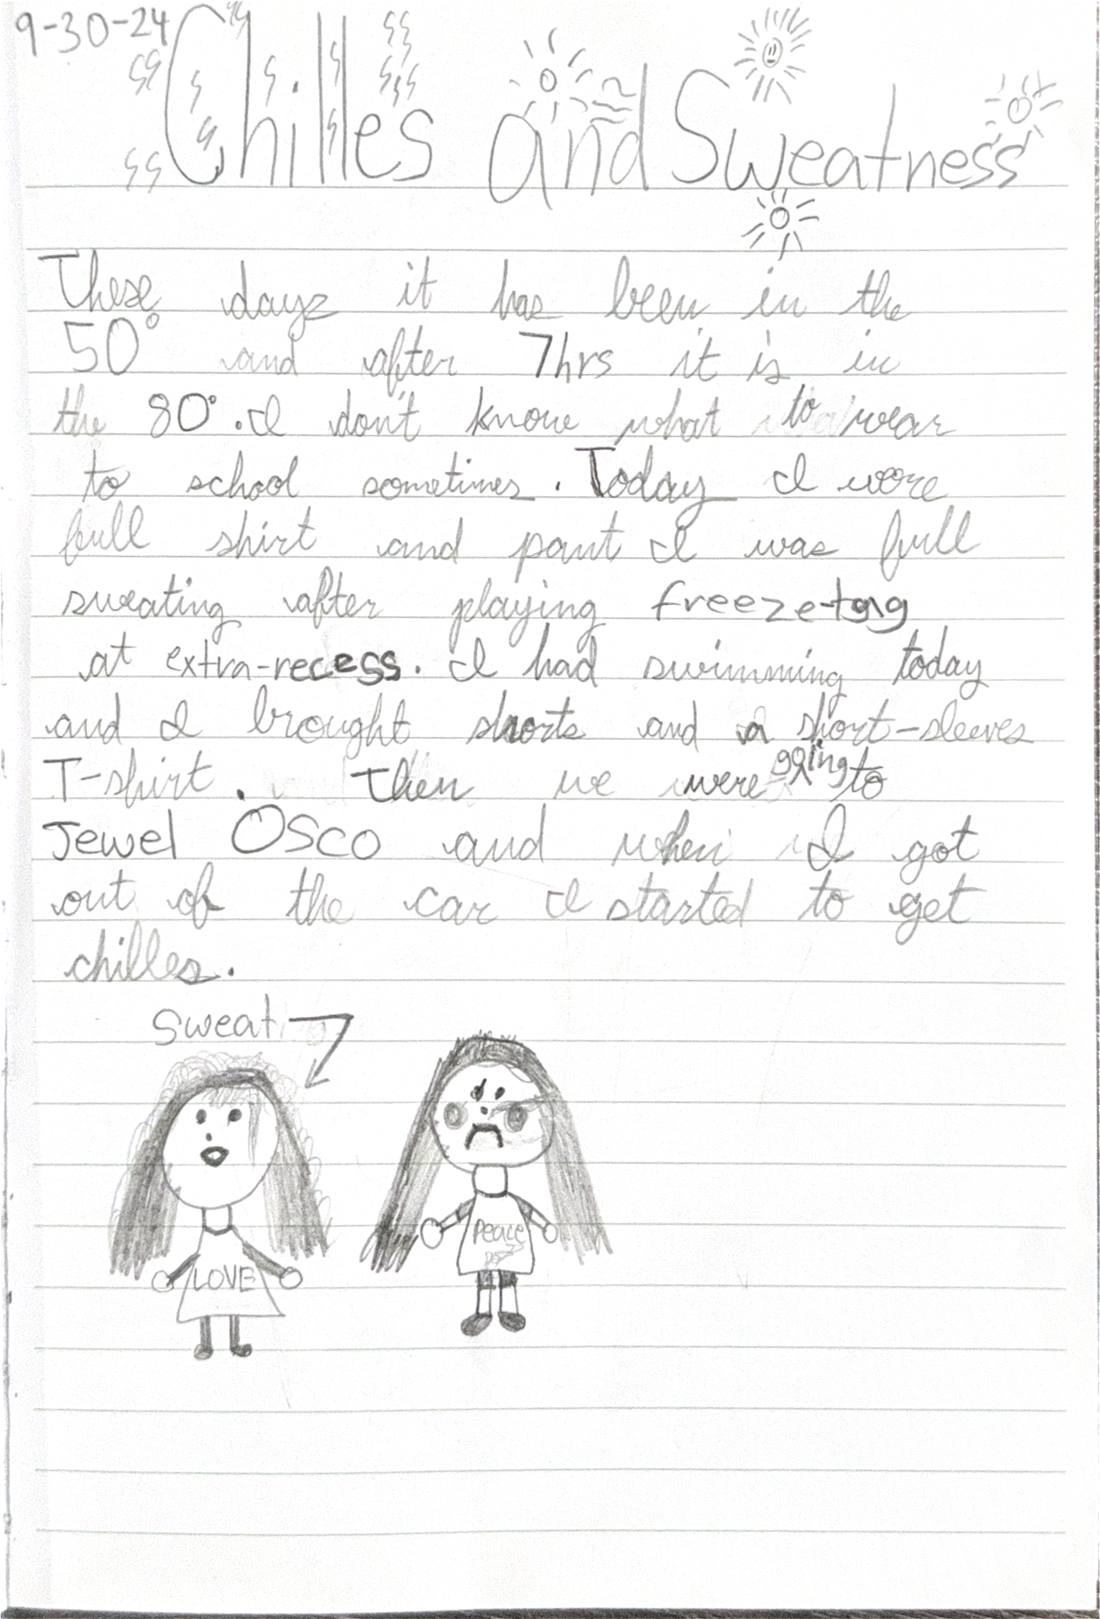
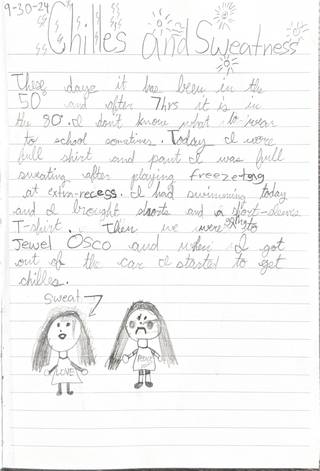 Chilles and sweatnessSep 30, 2024
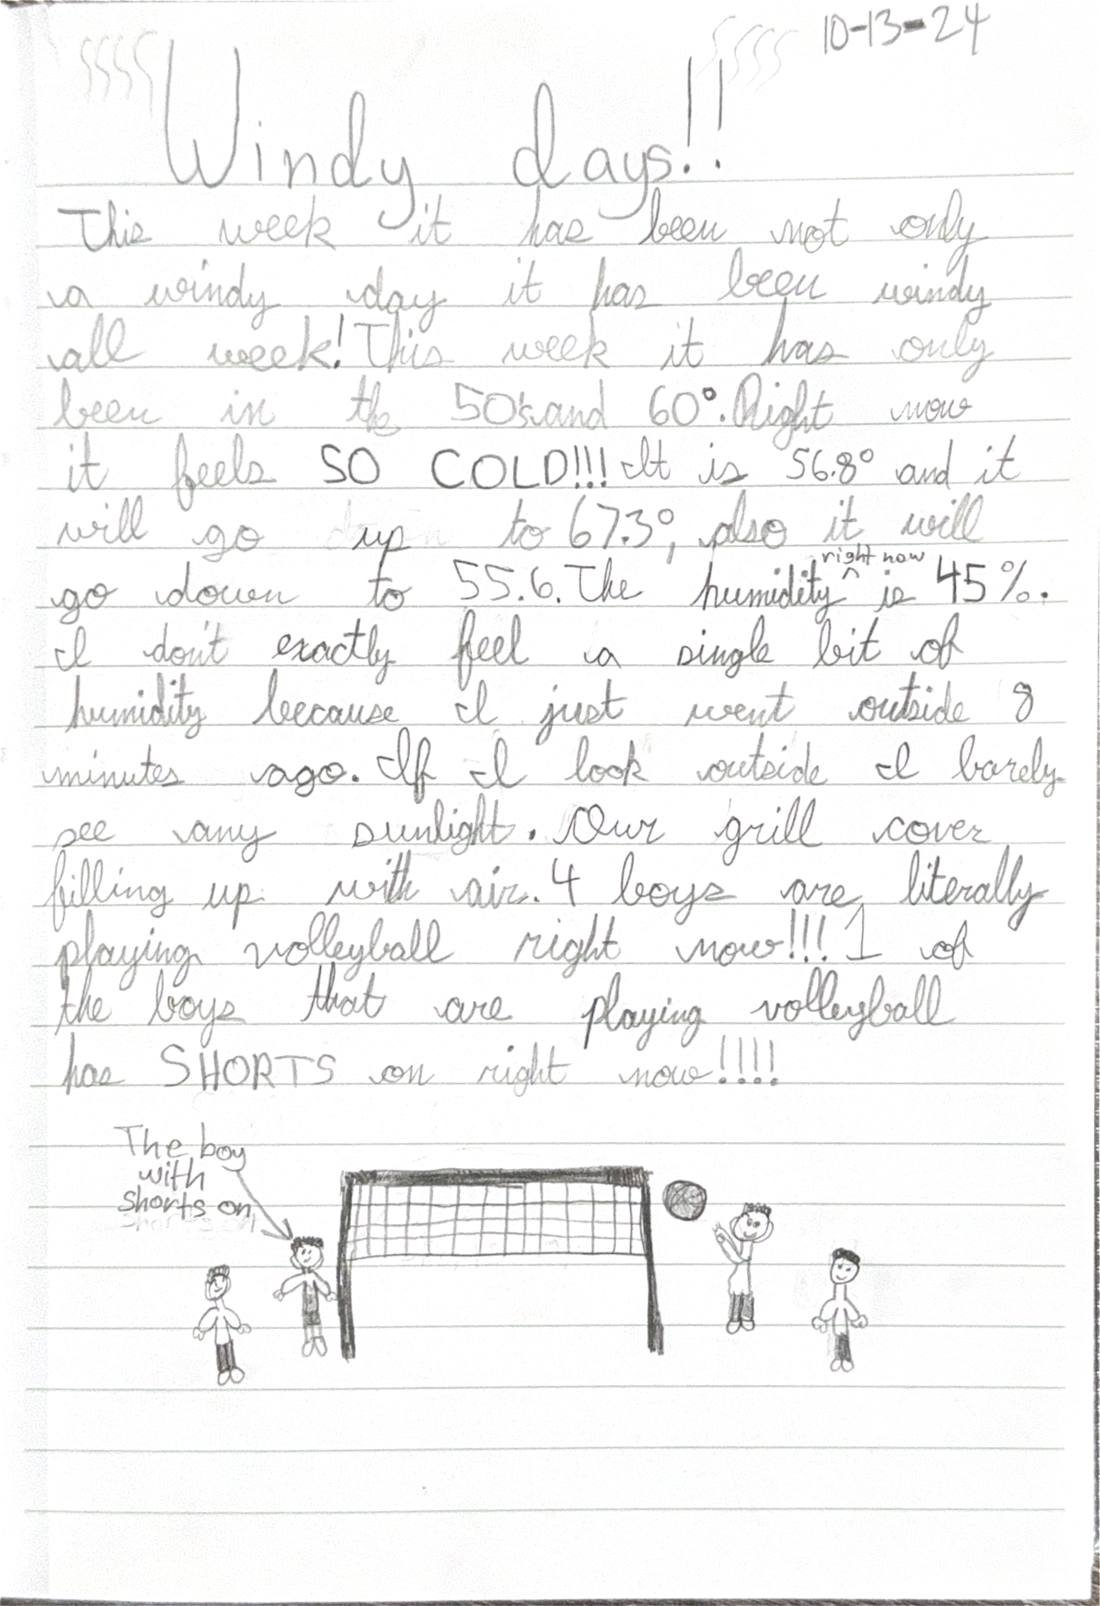
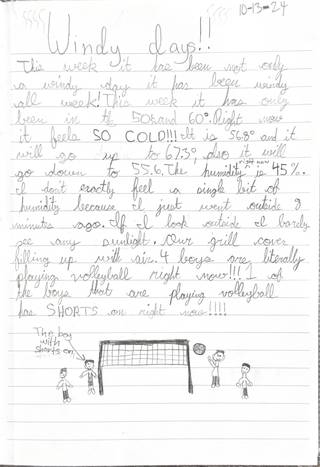 Windy days!!Oct 13, 2024
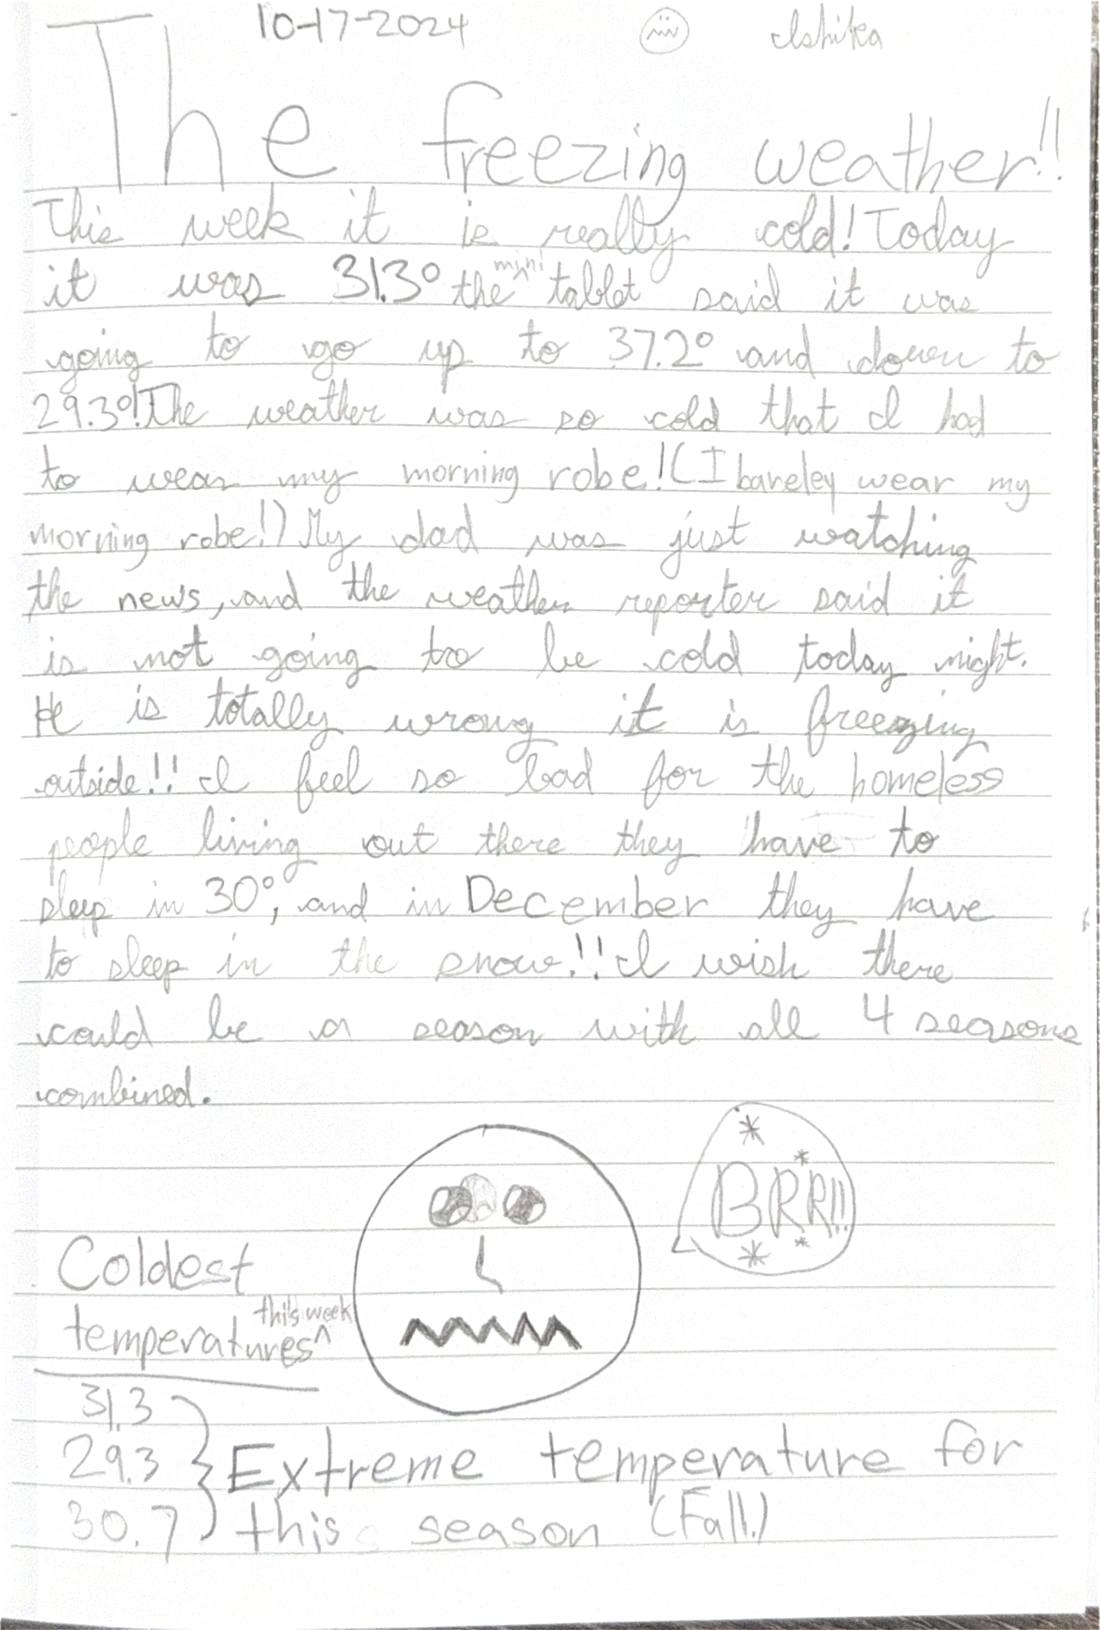
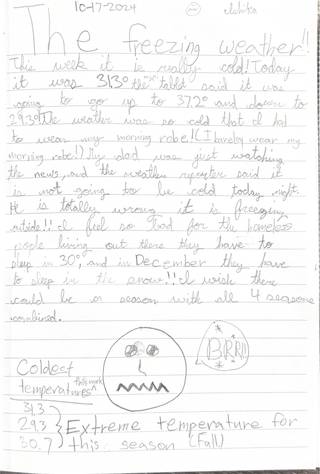 The freezing weather!!Oct 17, 2024
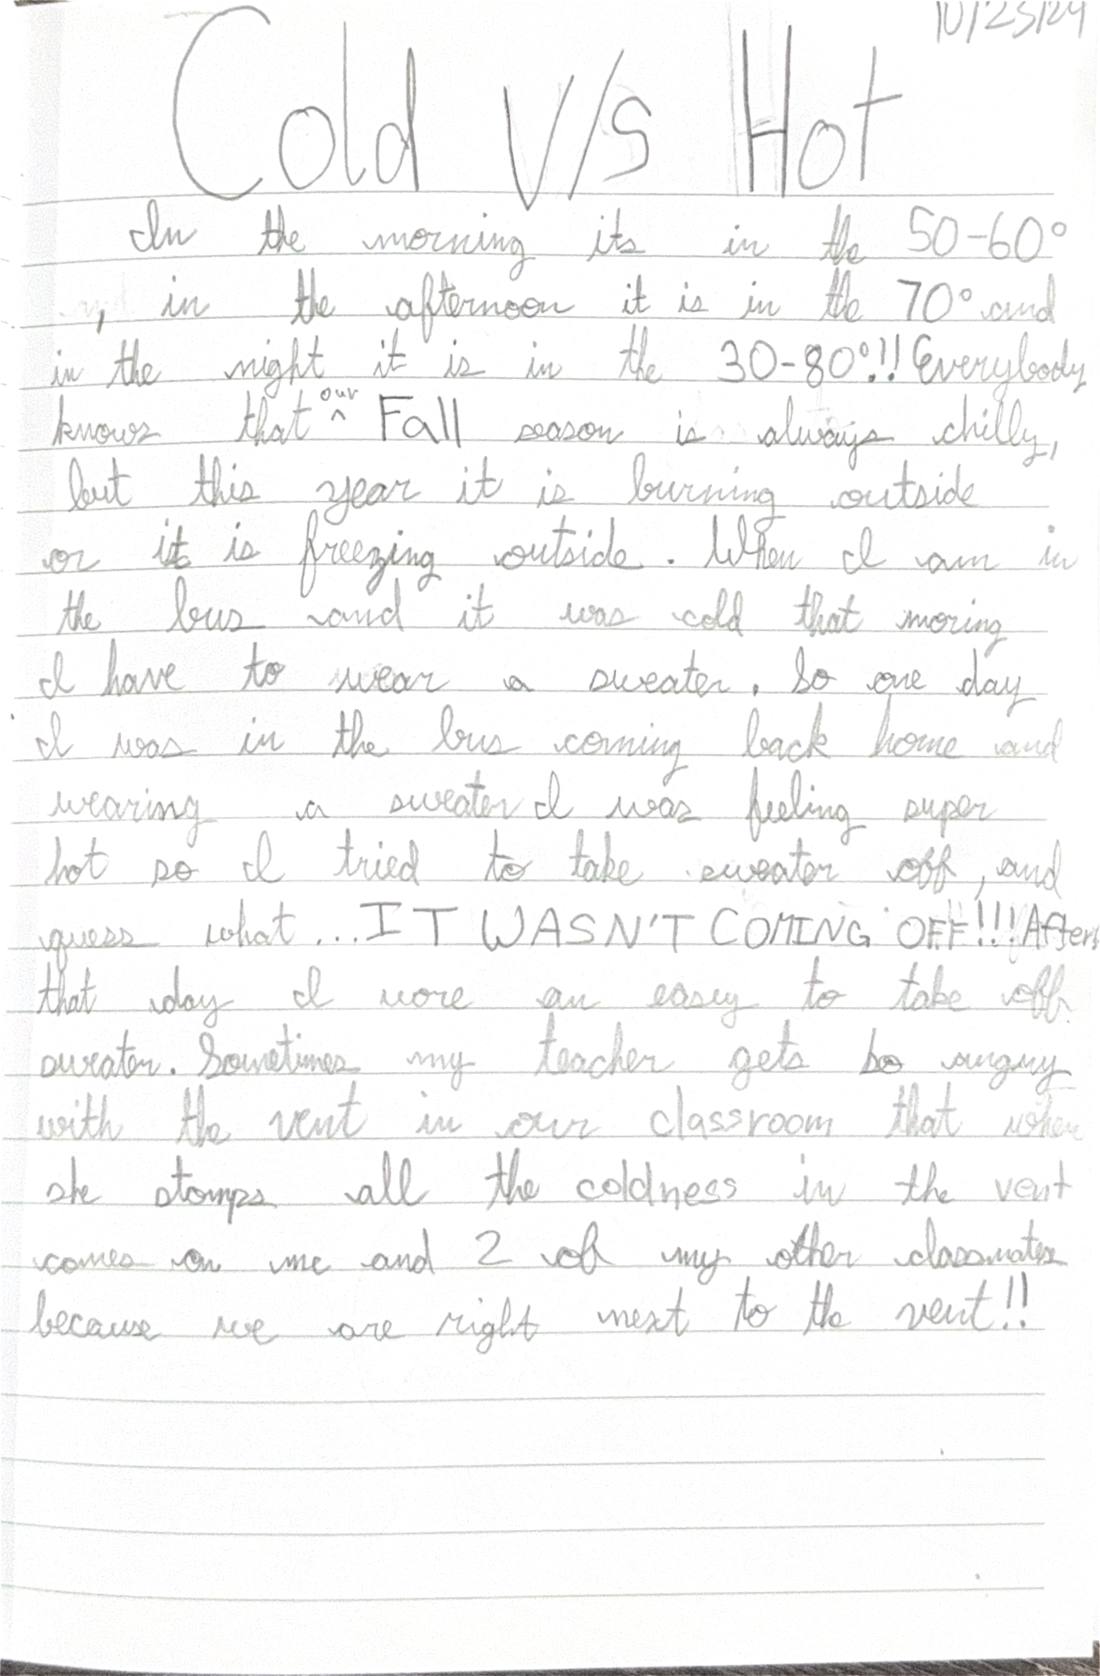
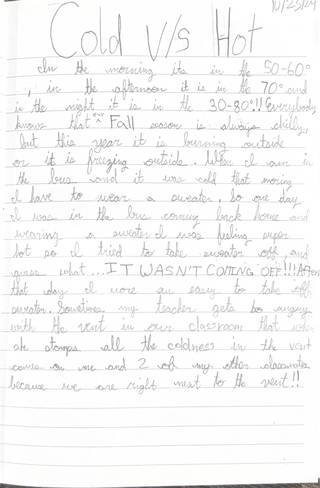 Cold v/s hotOct 23, 2024
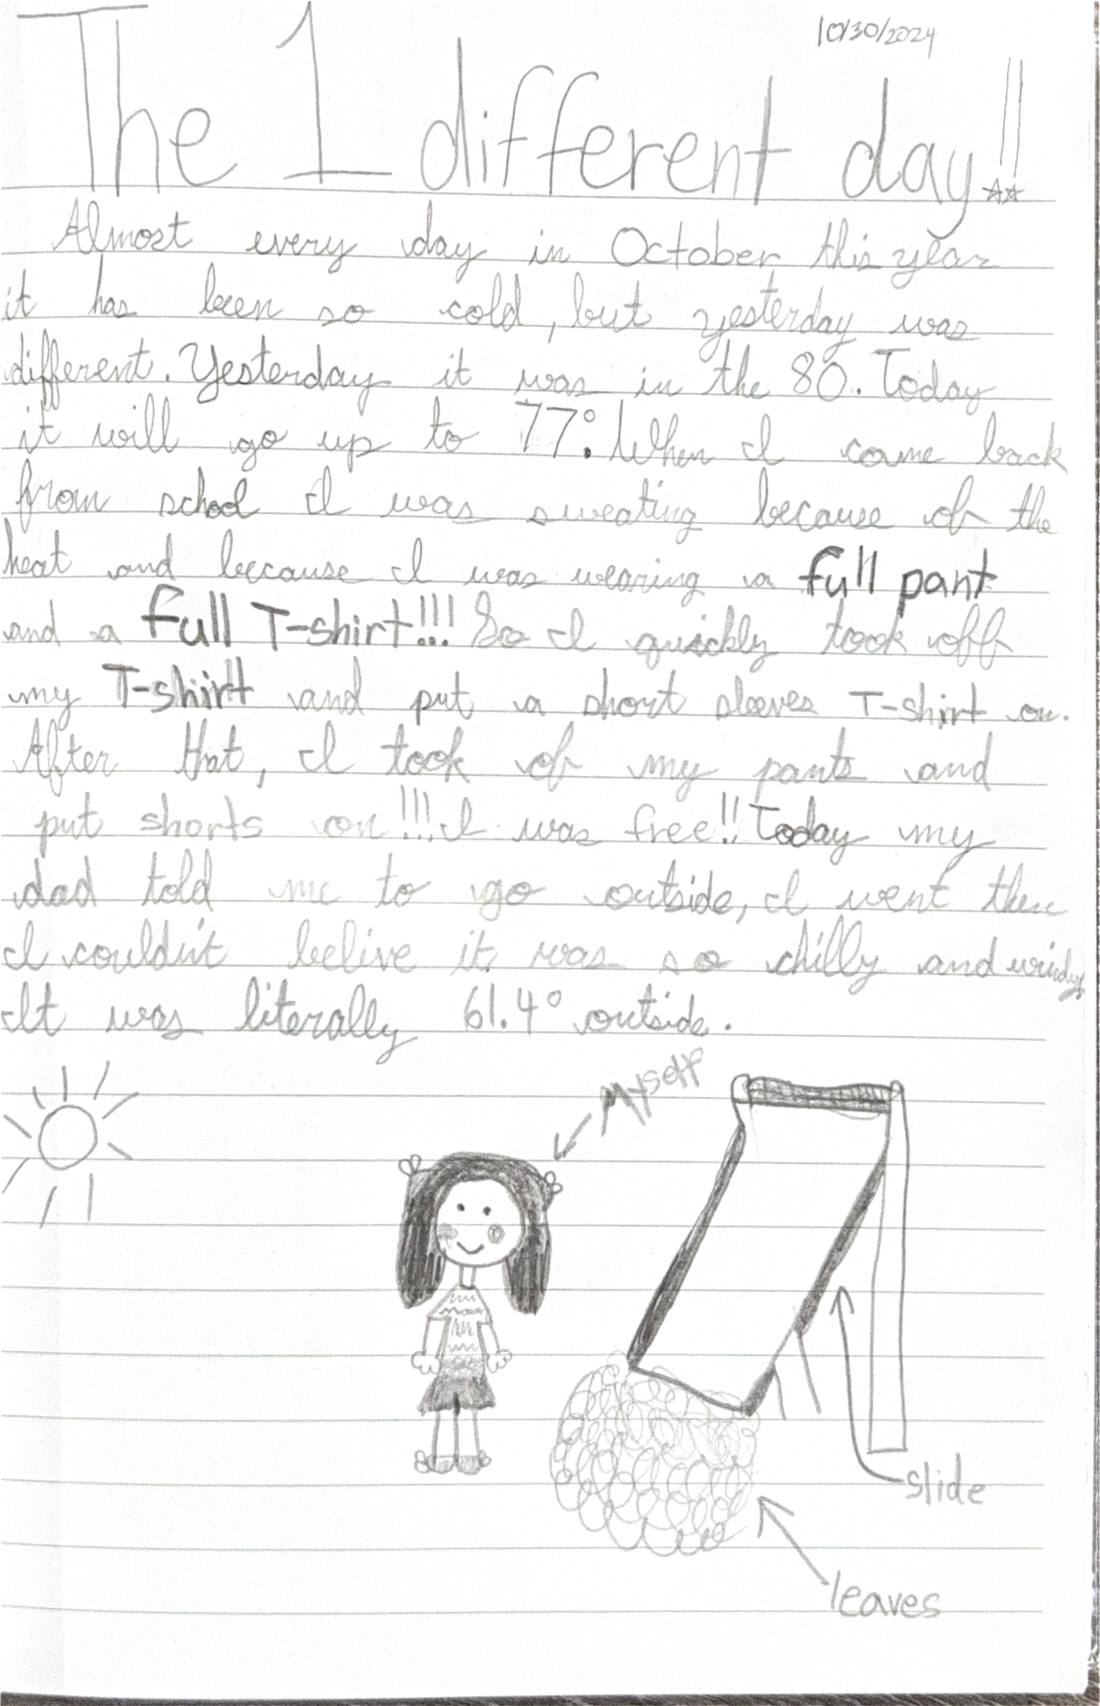
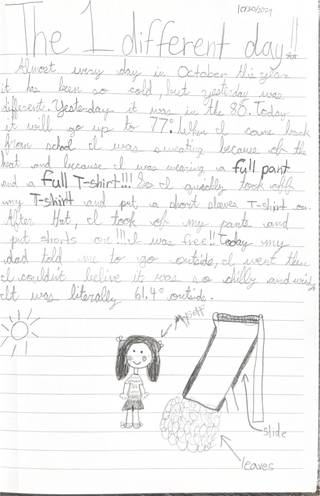 The 1 different day!!Oct 30, 2024
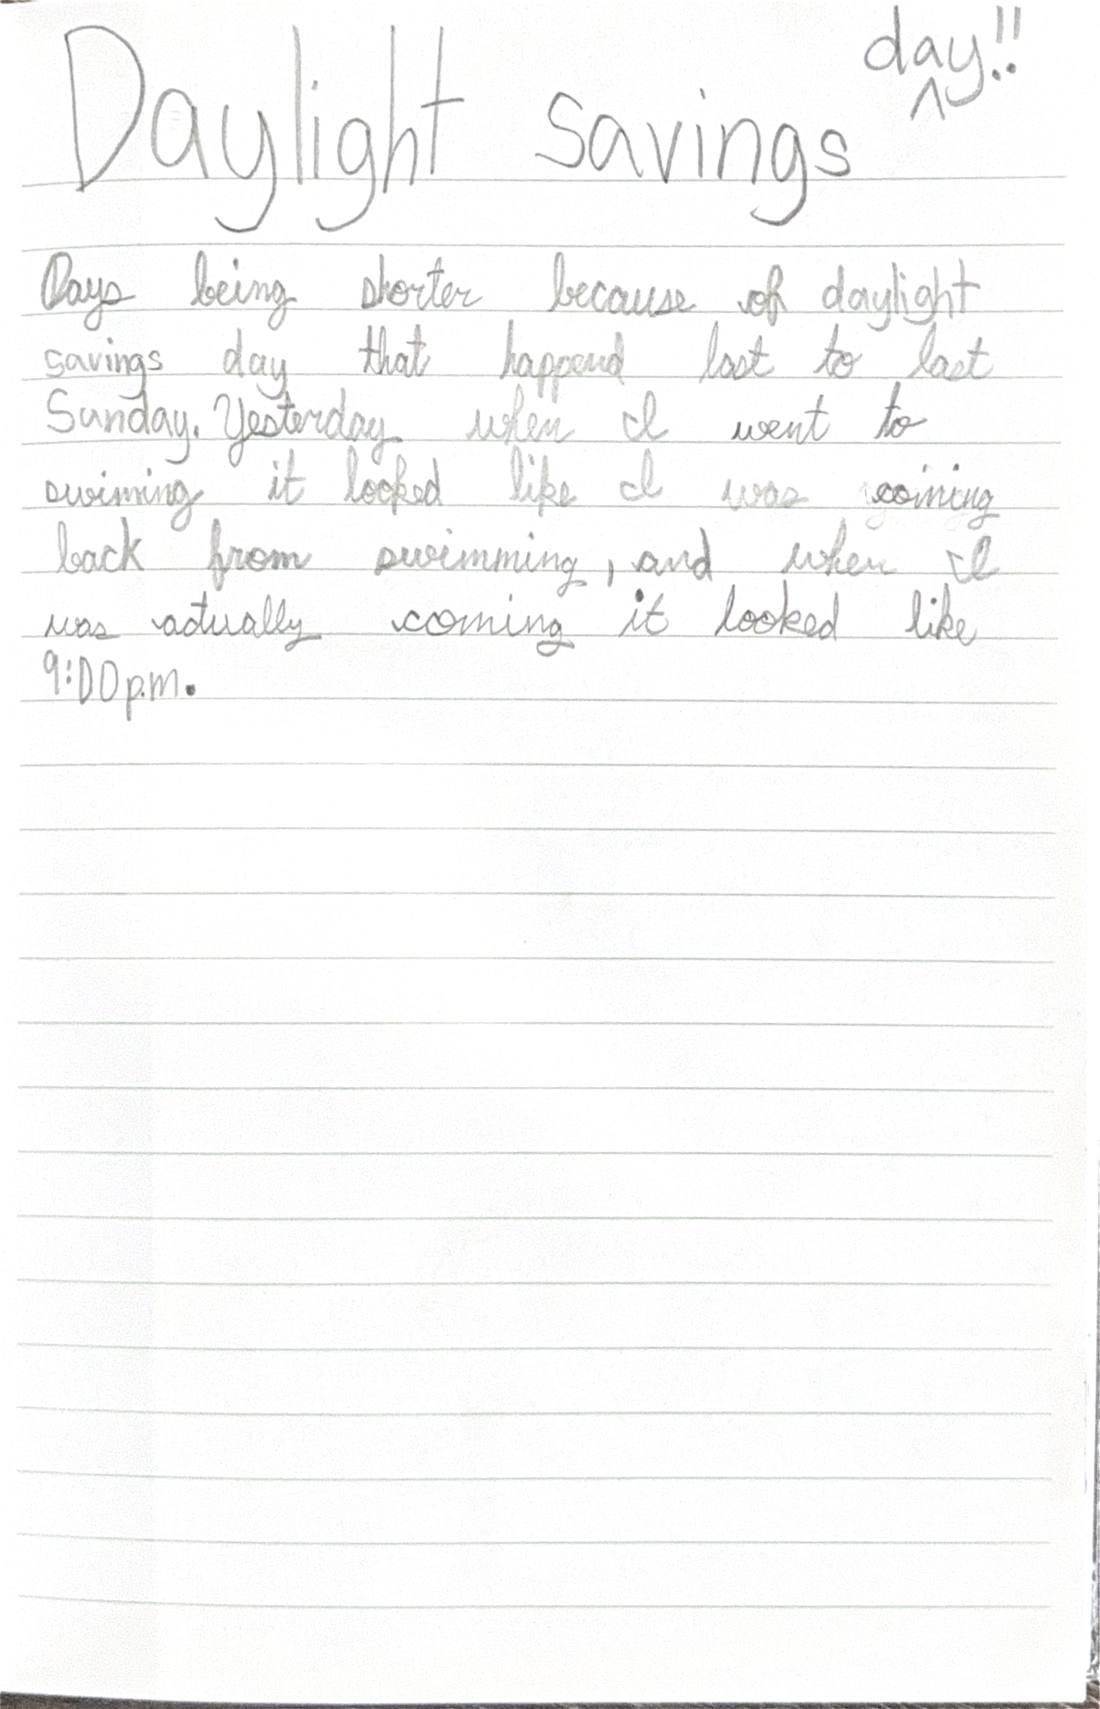
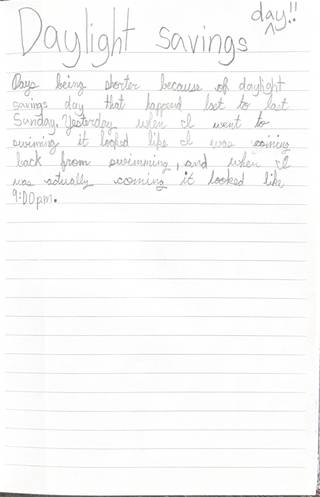 Daylight savings day!!Nov 3, 2024
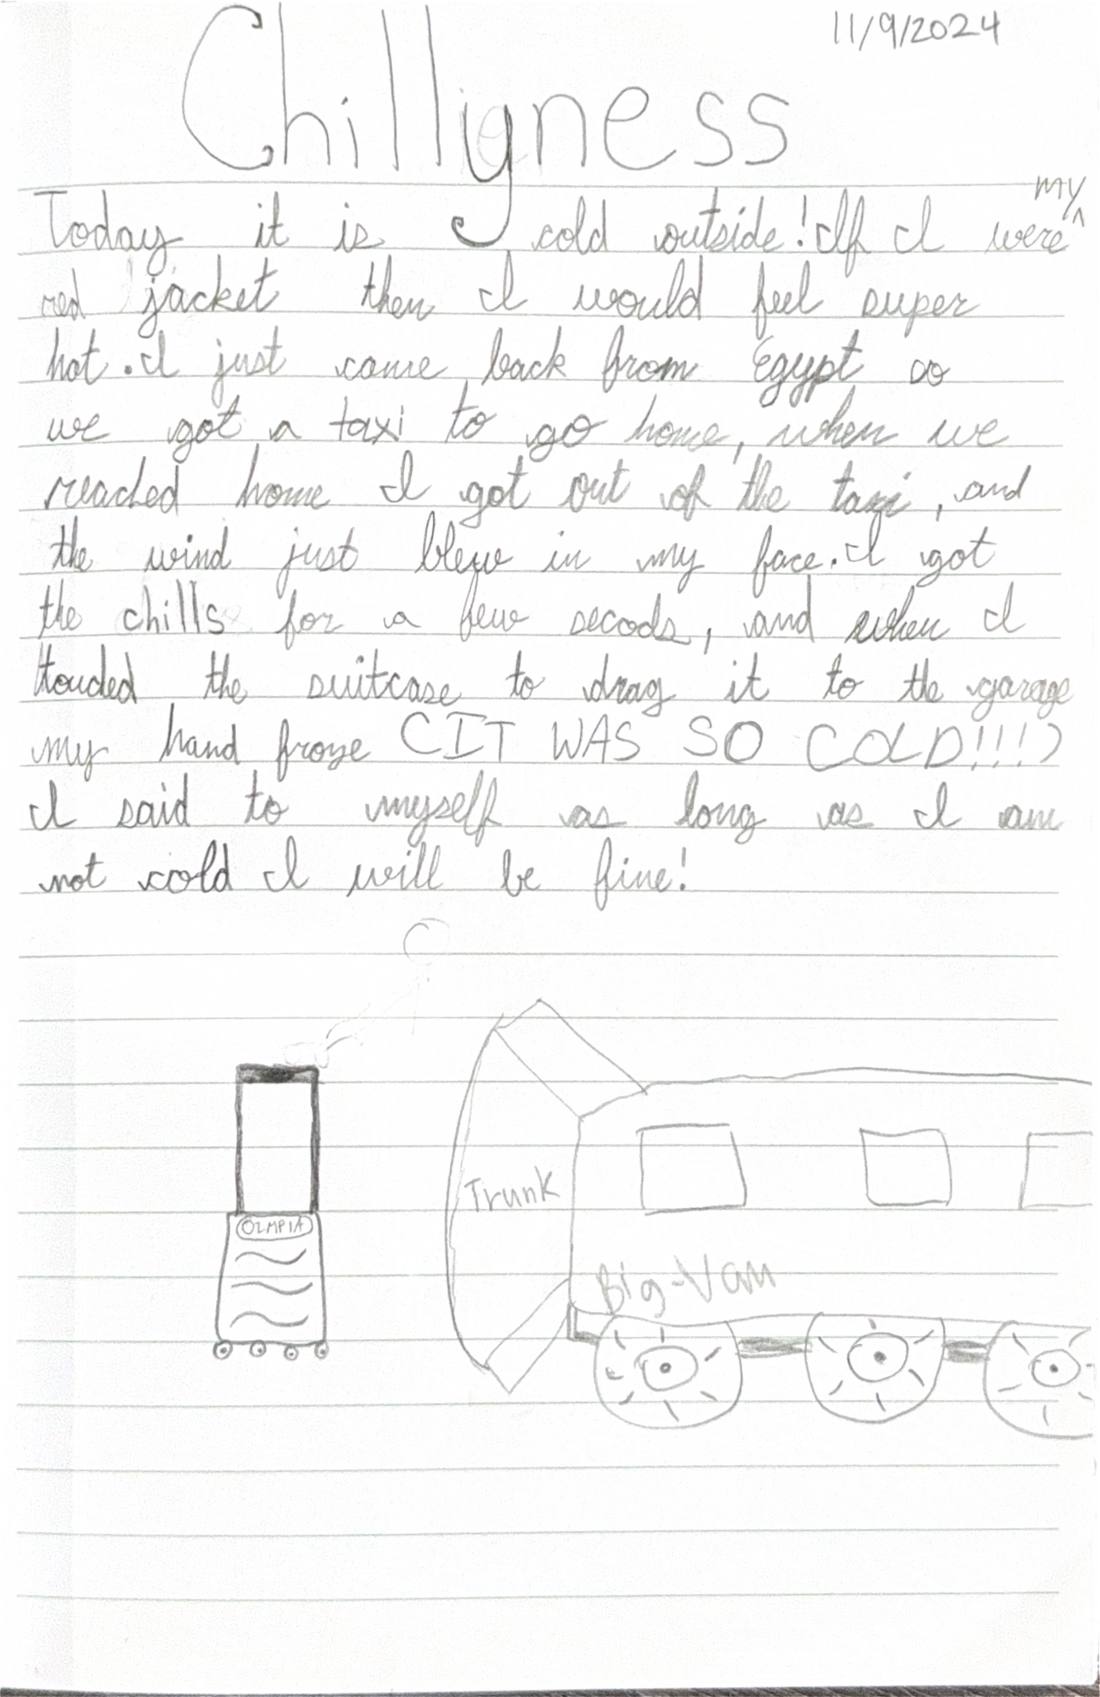
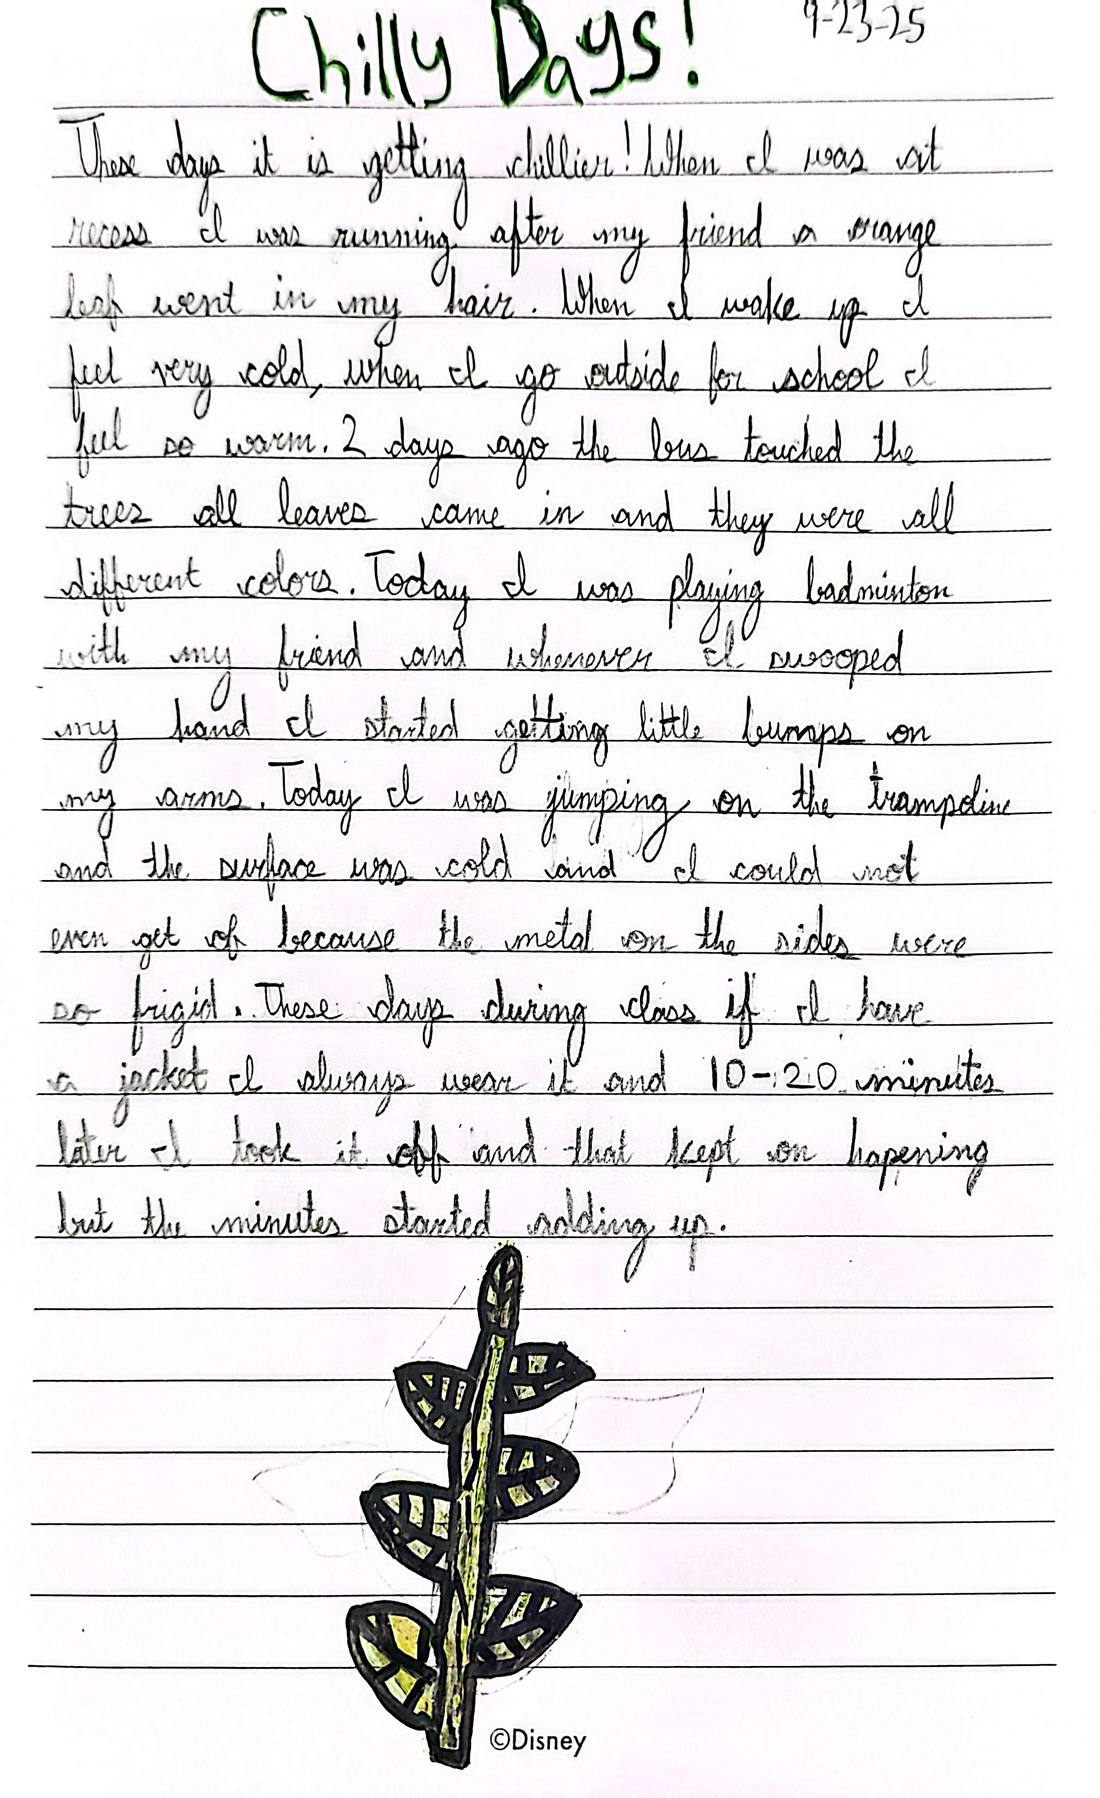
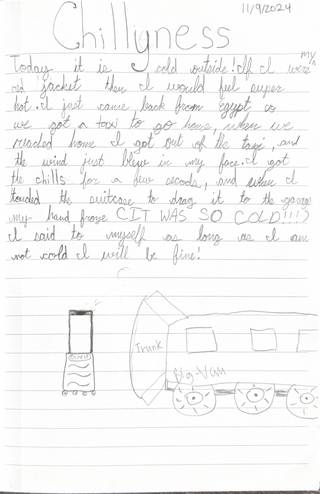 ChillynessNov 9, 2024
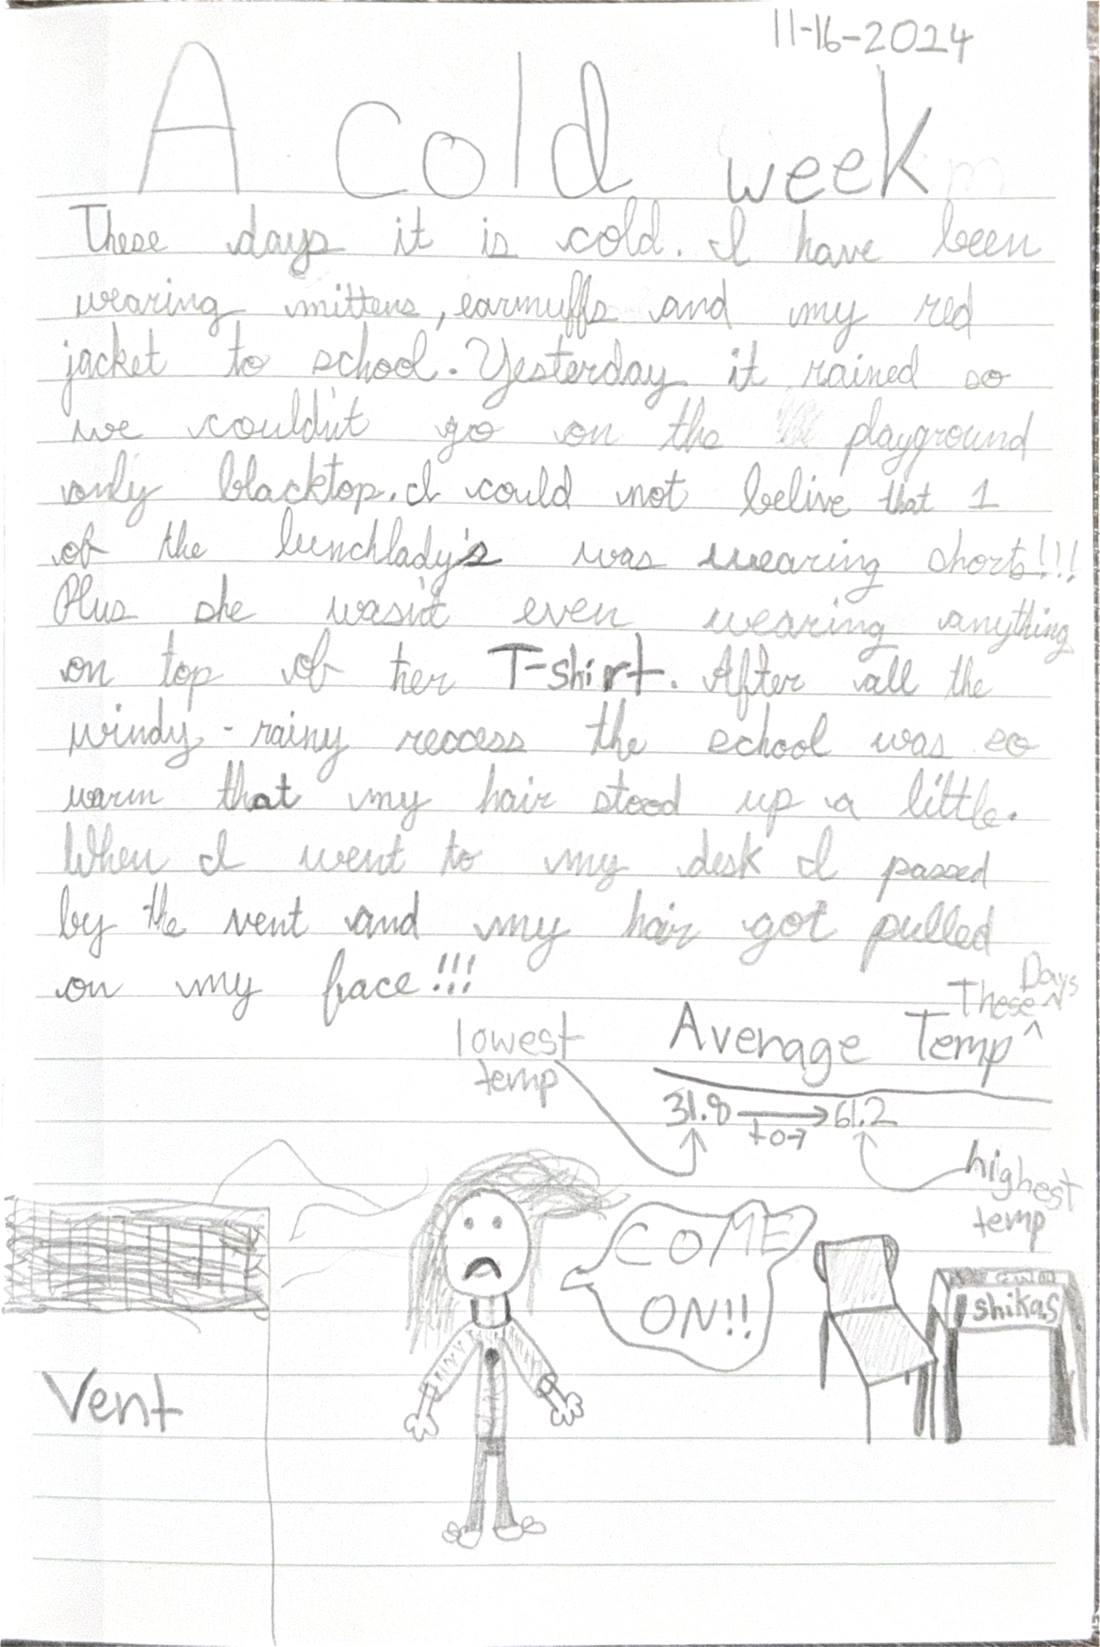
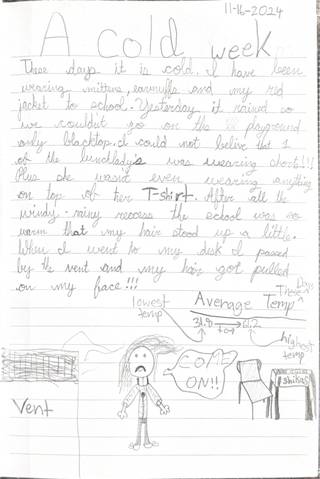 A cold weekNov 16, 2024
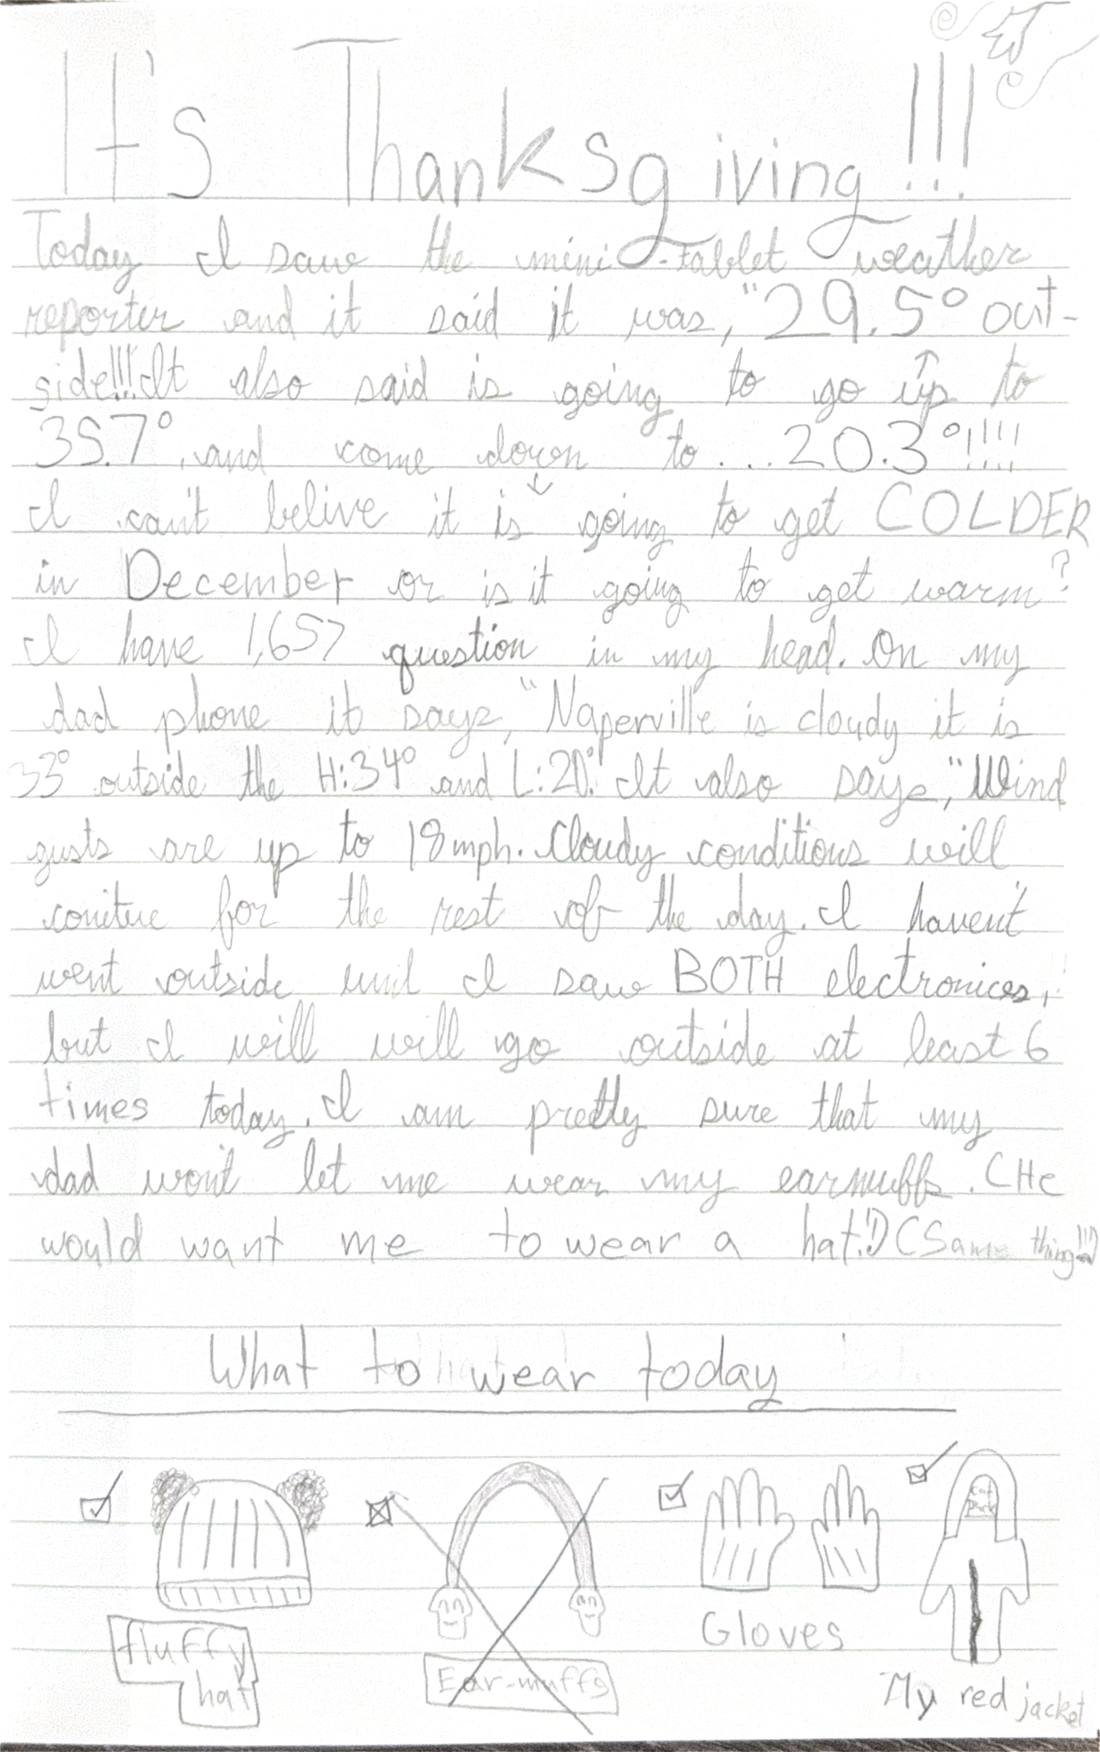
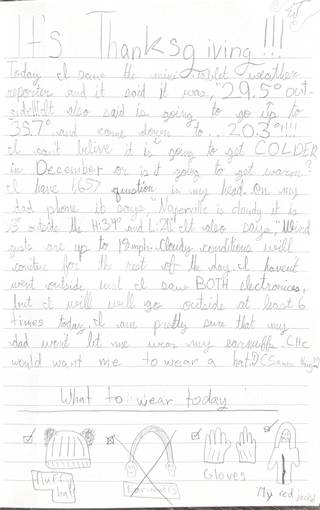 It's Thanksgiving!!!Nov 28, 2024
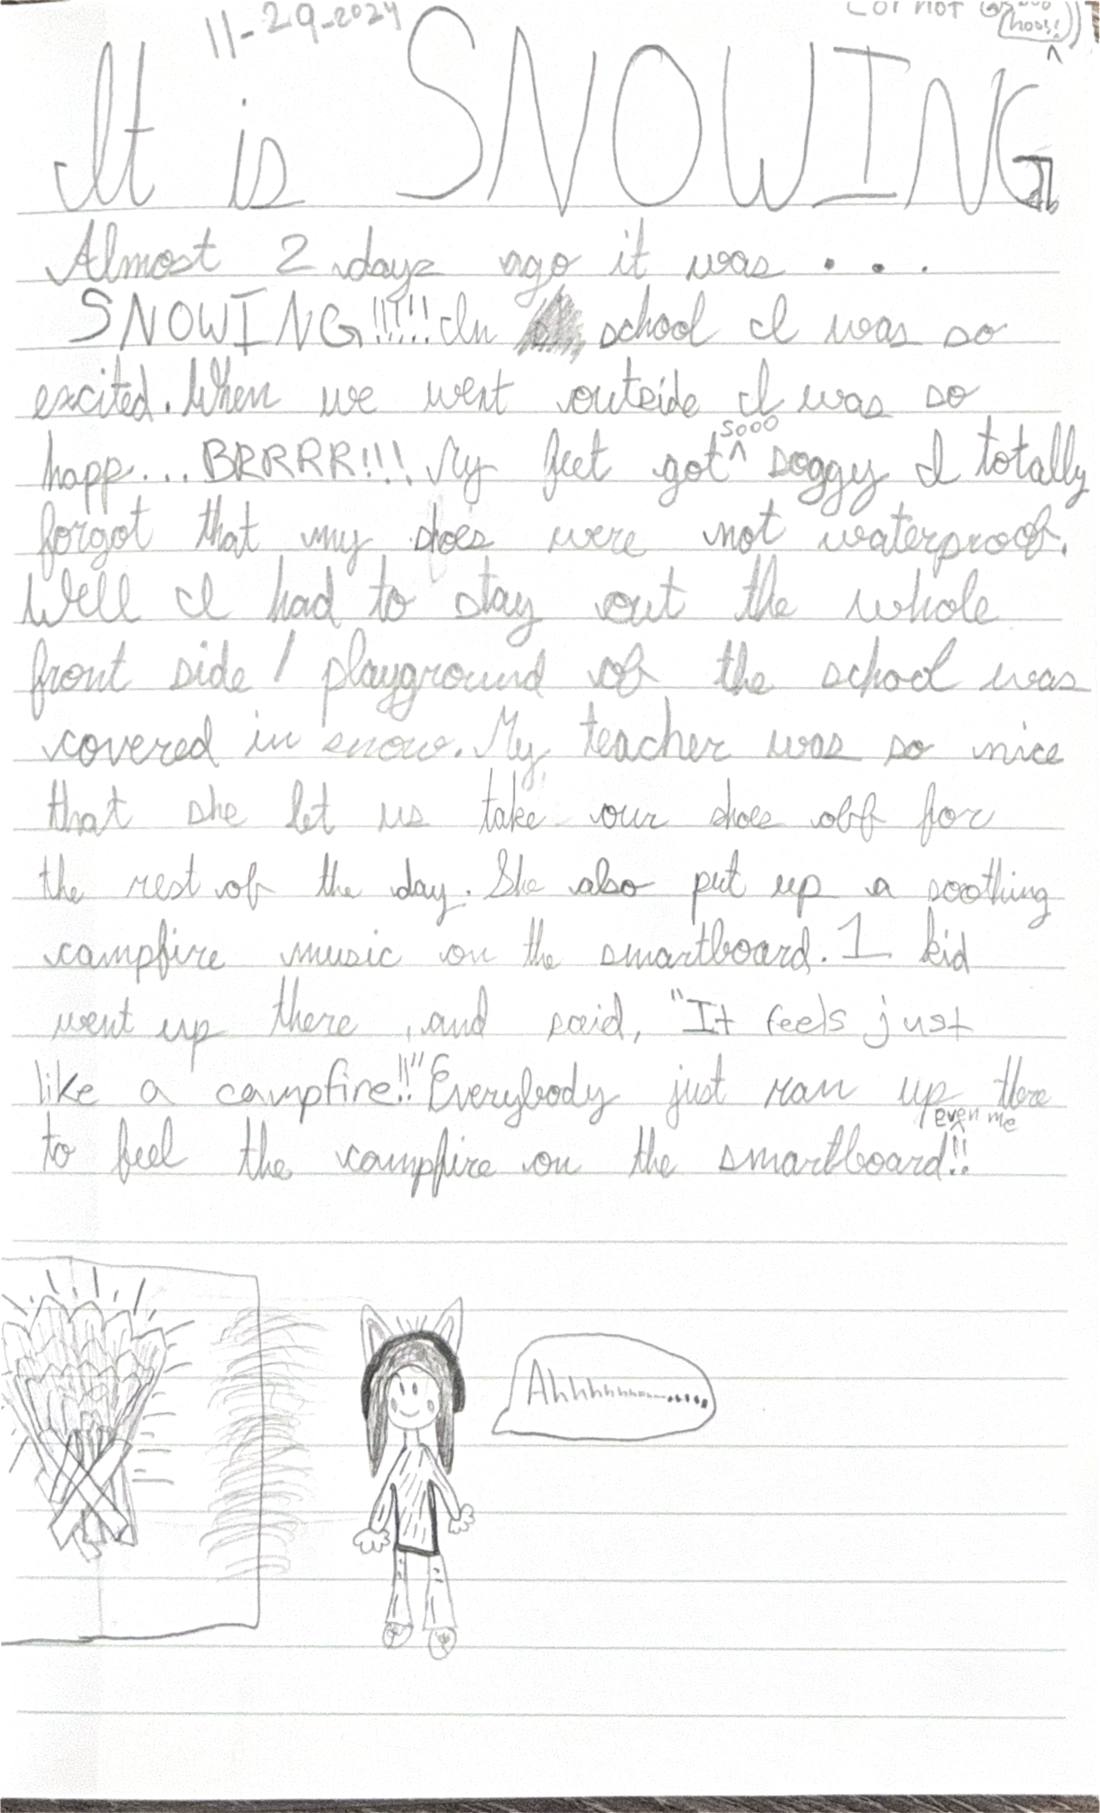
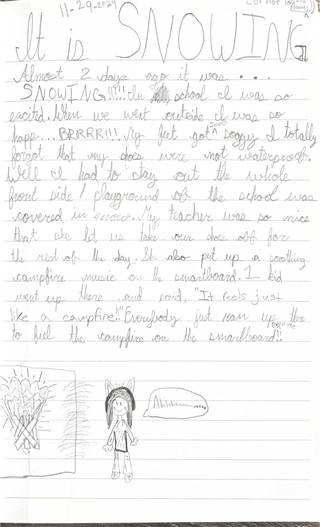 It is SNOWINGNov 29, 2024
Winter 2024–25 9 pages
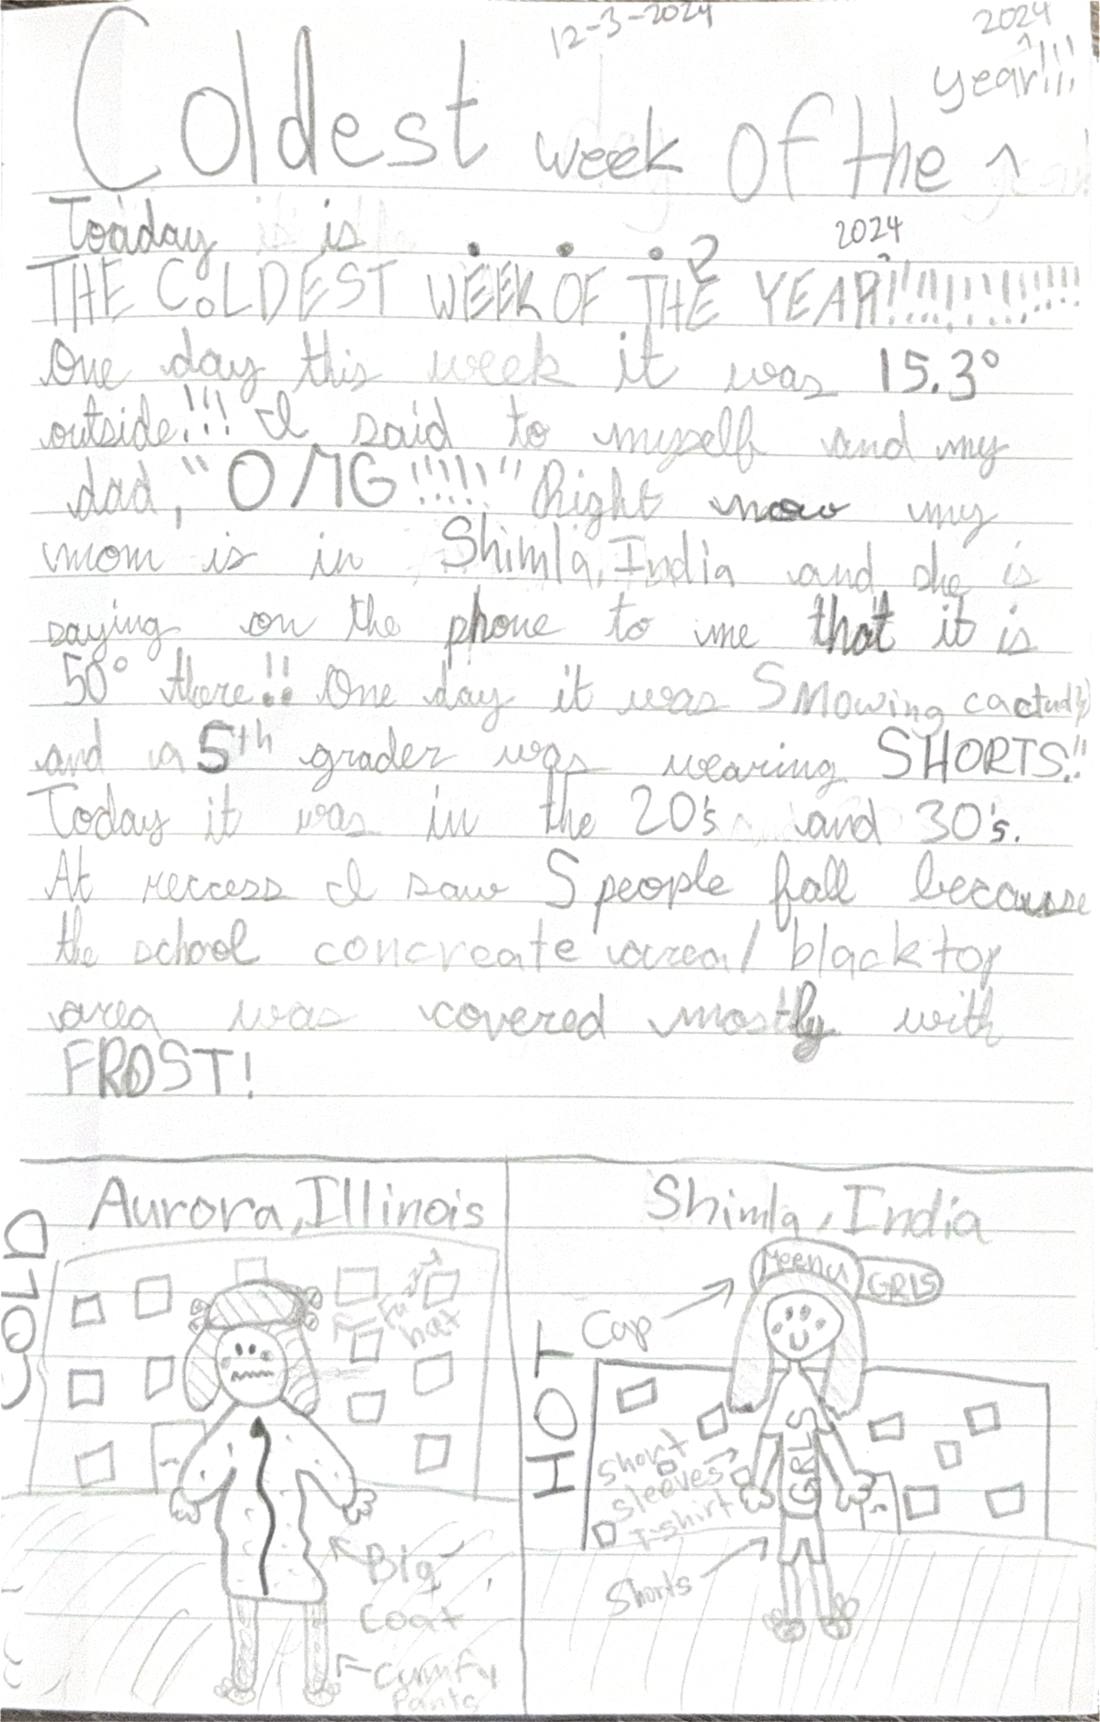
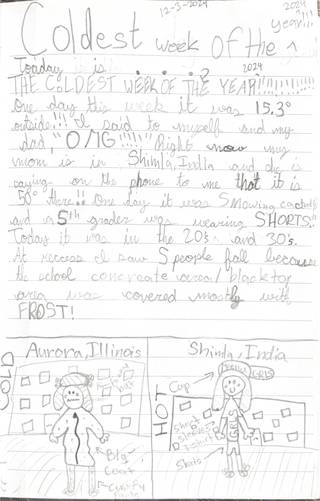 Coldest week of the year!!Dec 3, 2024
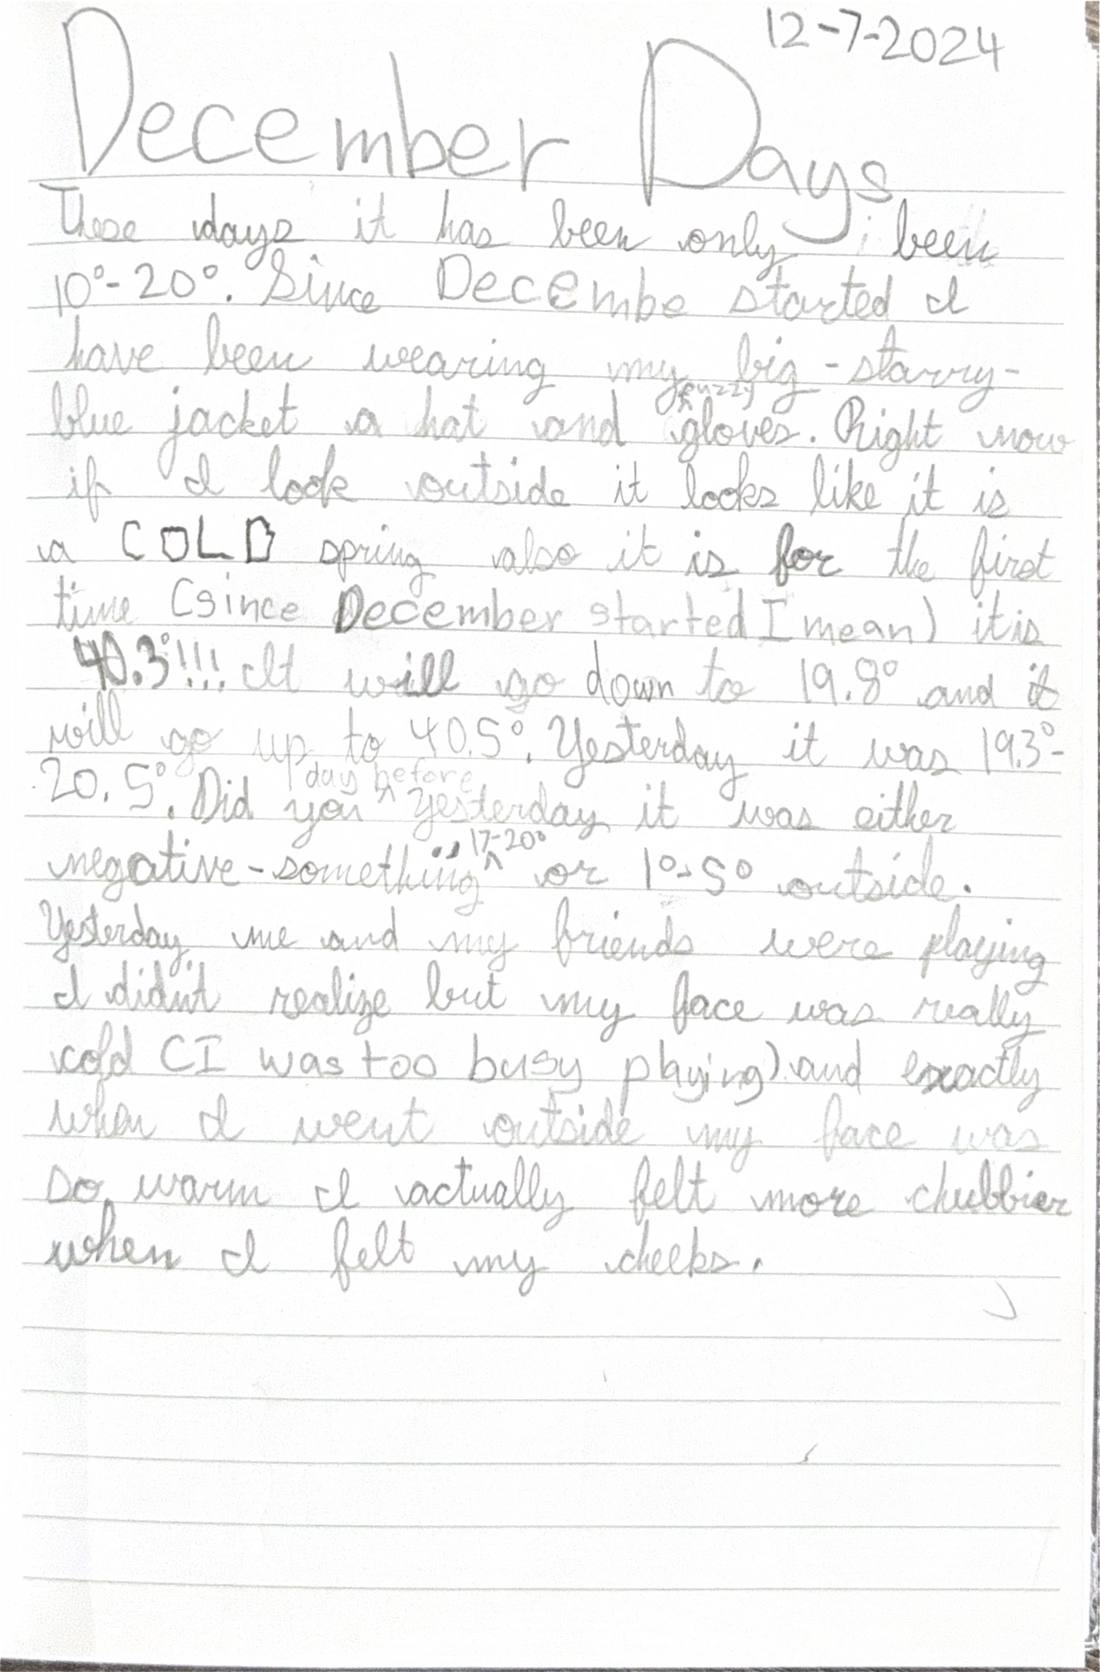
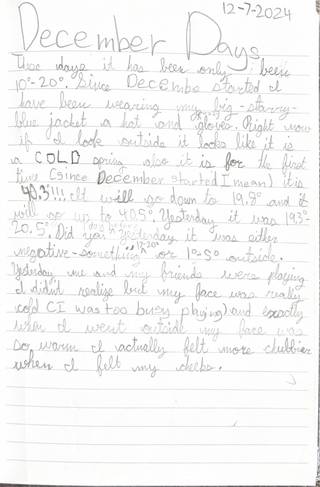 December daysDec 7, 2024
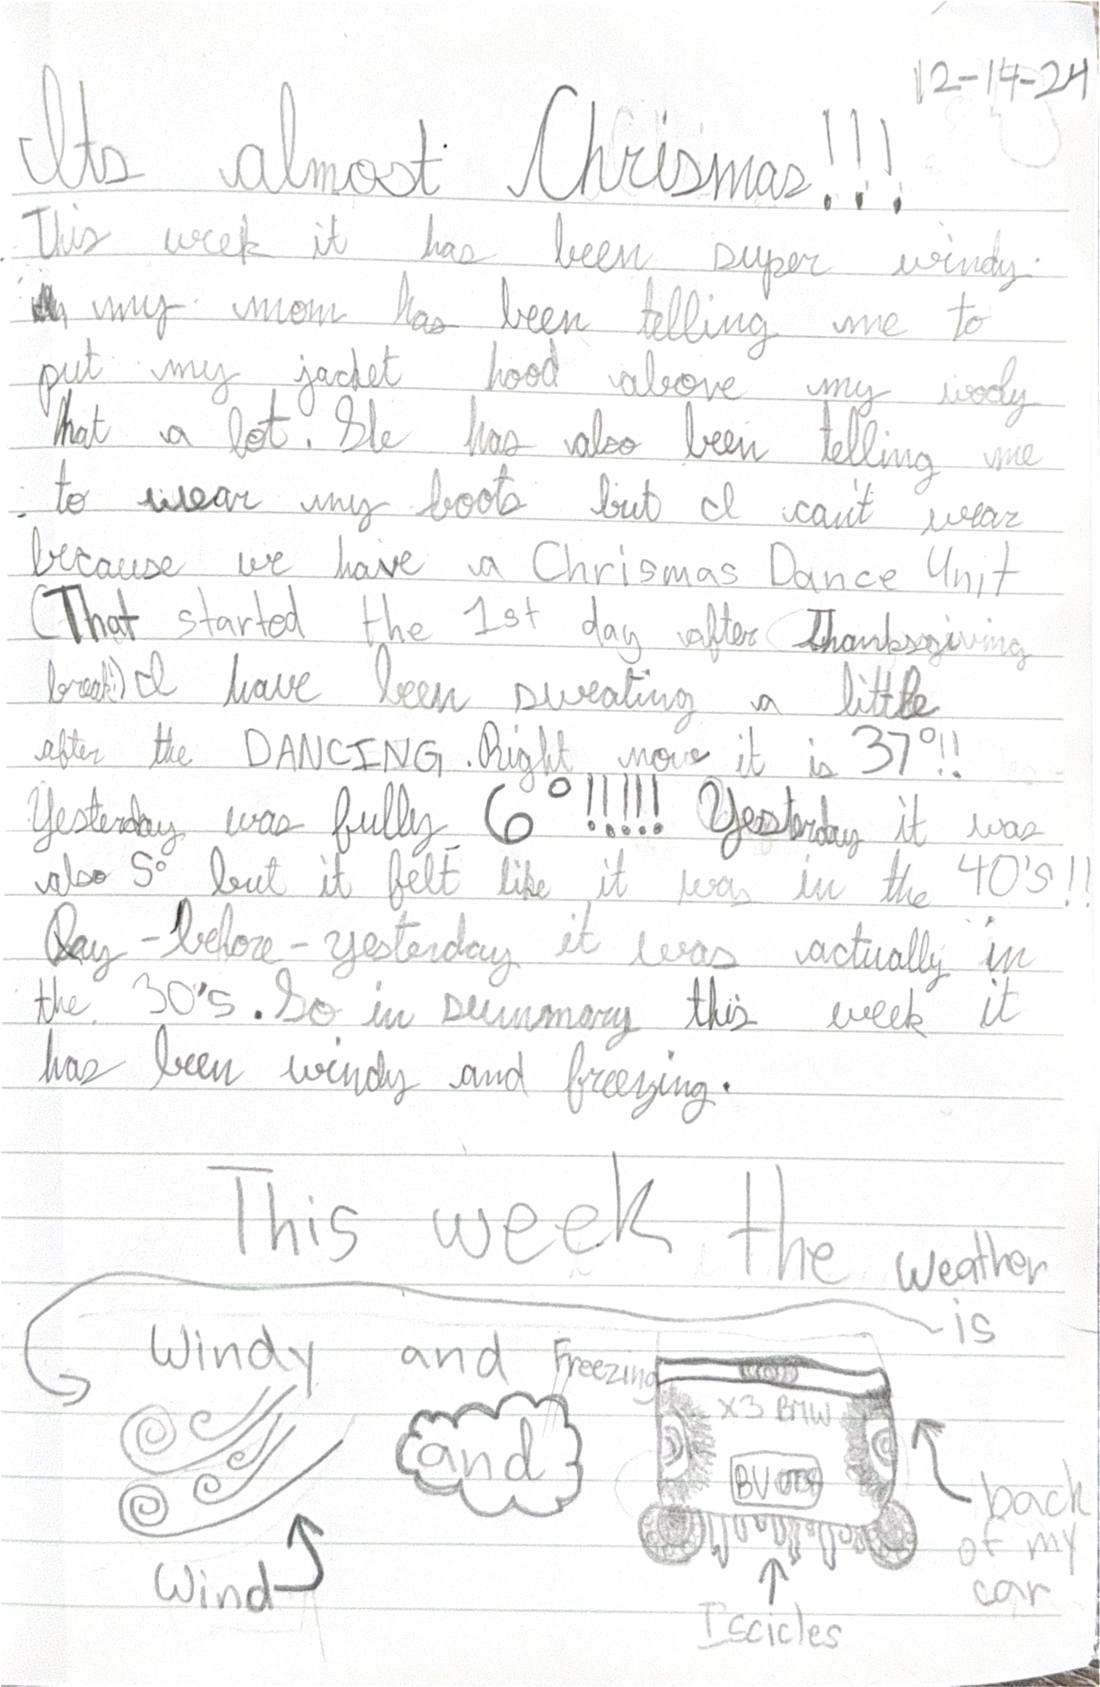
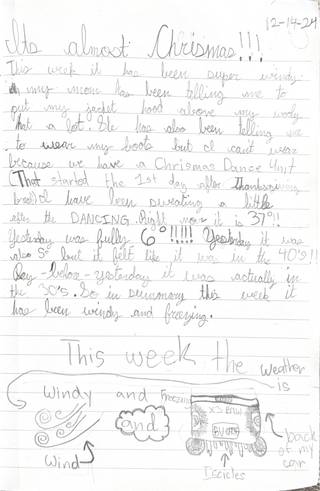 It's almost Christmas!!!Dec 14, 2024
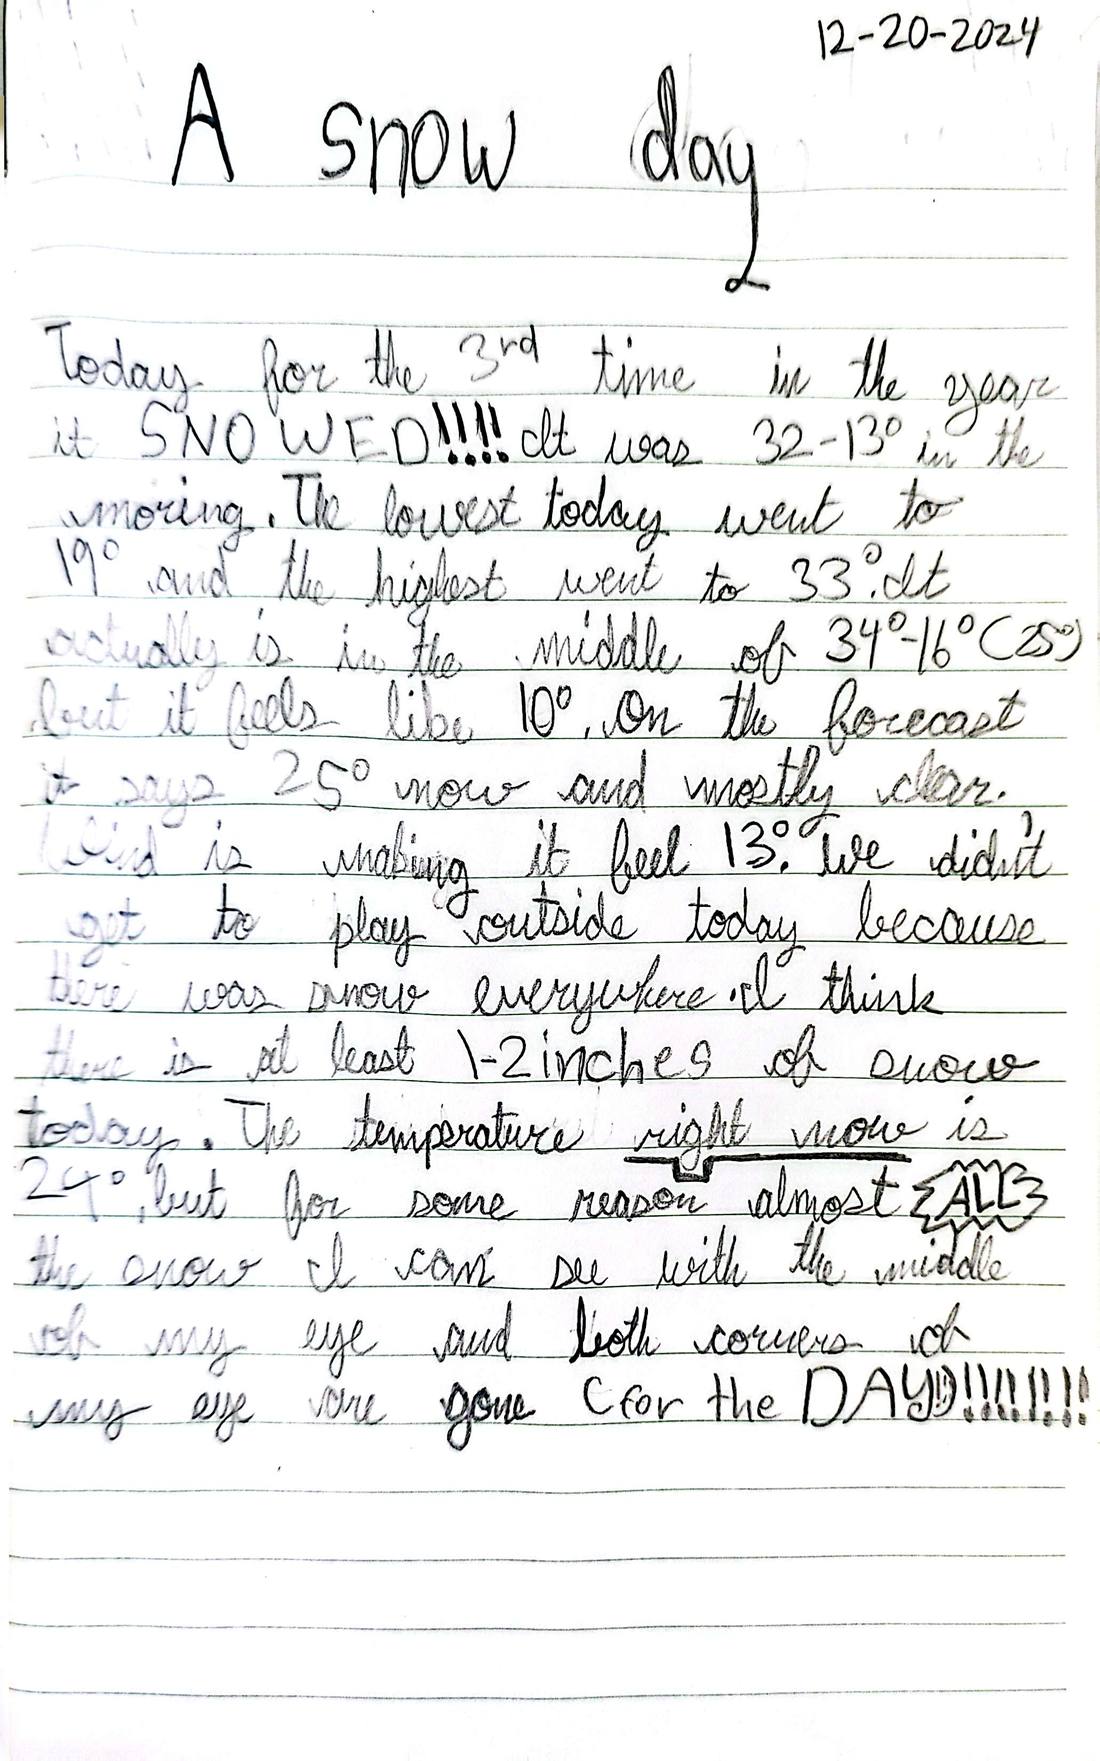
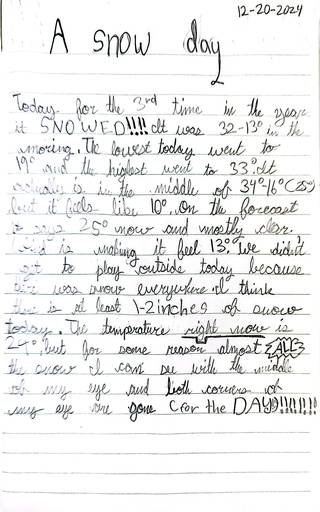 A snow dayDec 20, 2024
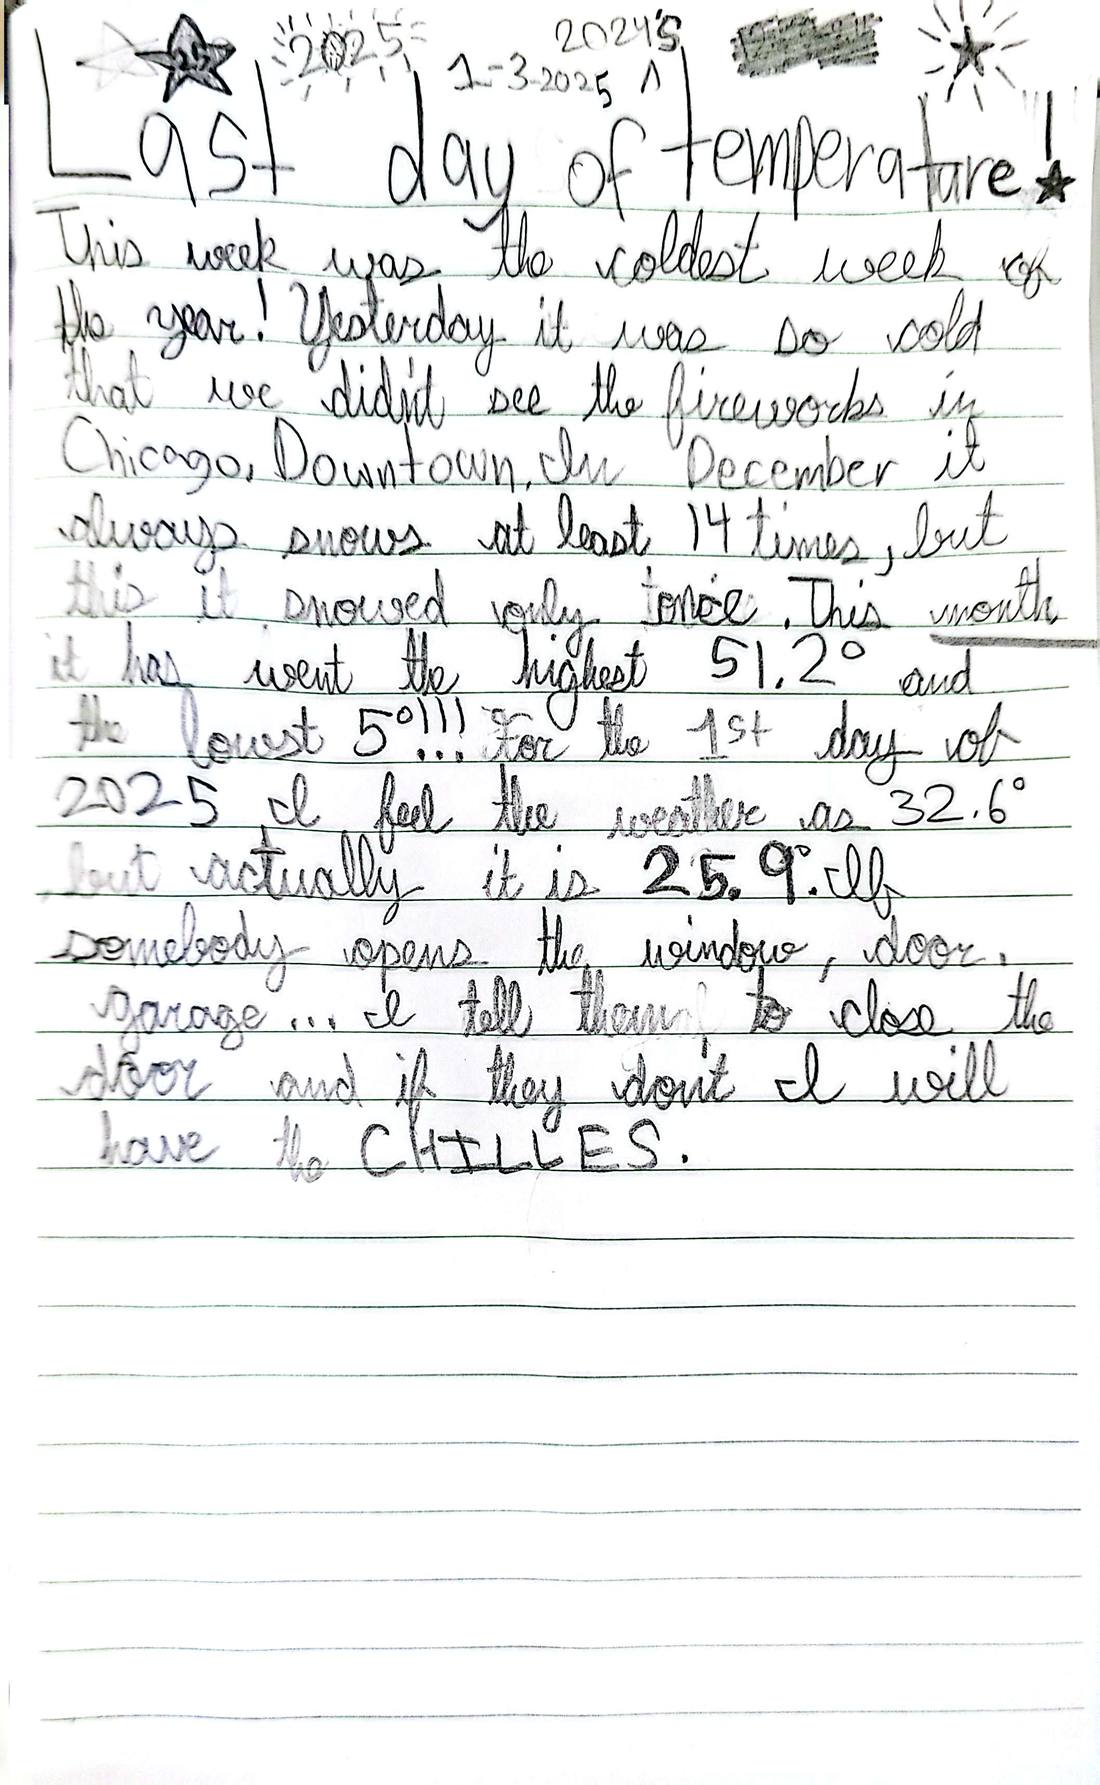
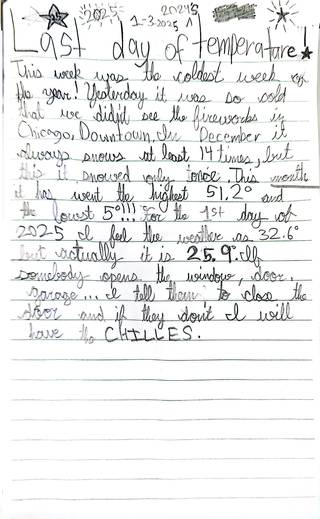 Last day of temperature!Jan 3, 2025
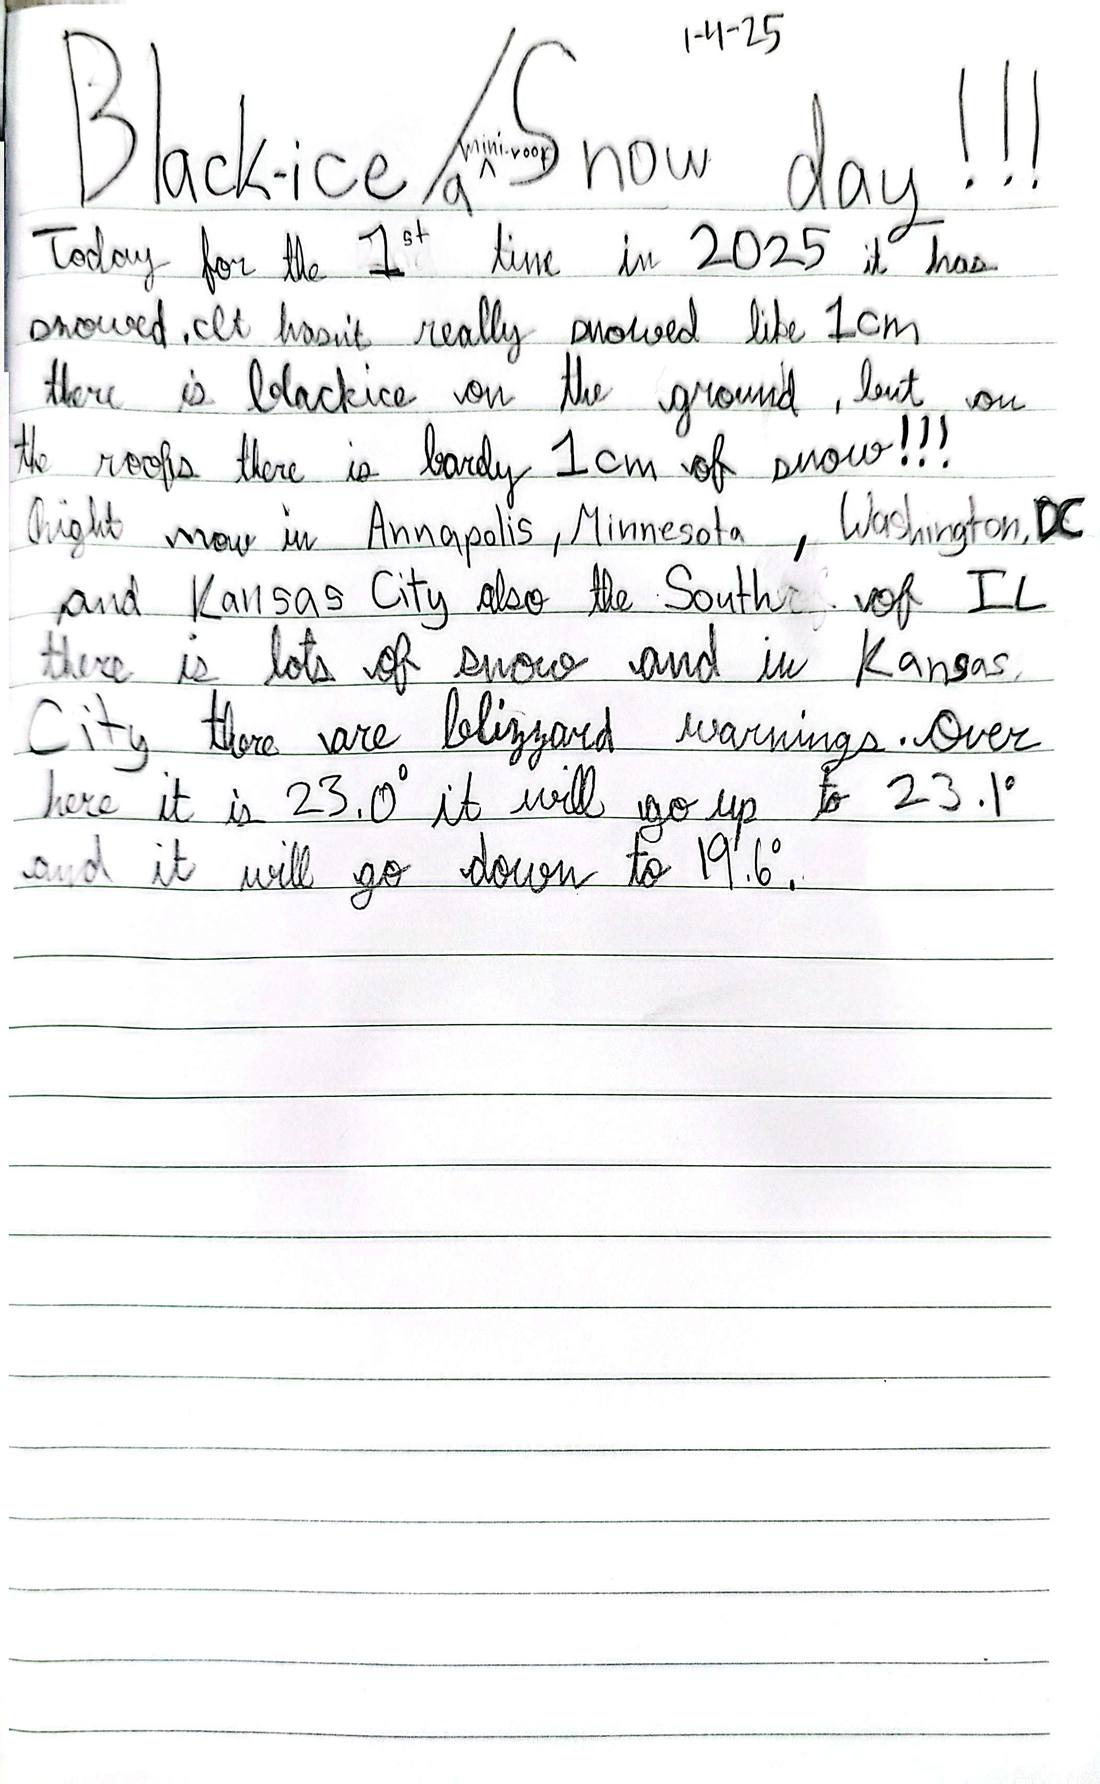
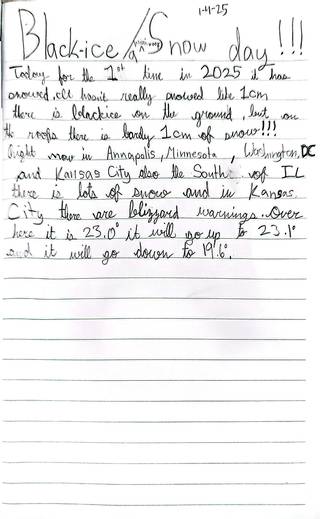 Black-ice / mini-snow day!!!Jan 4, 2025
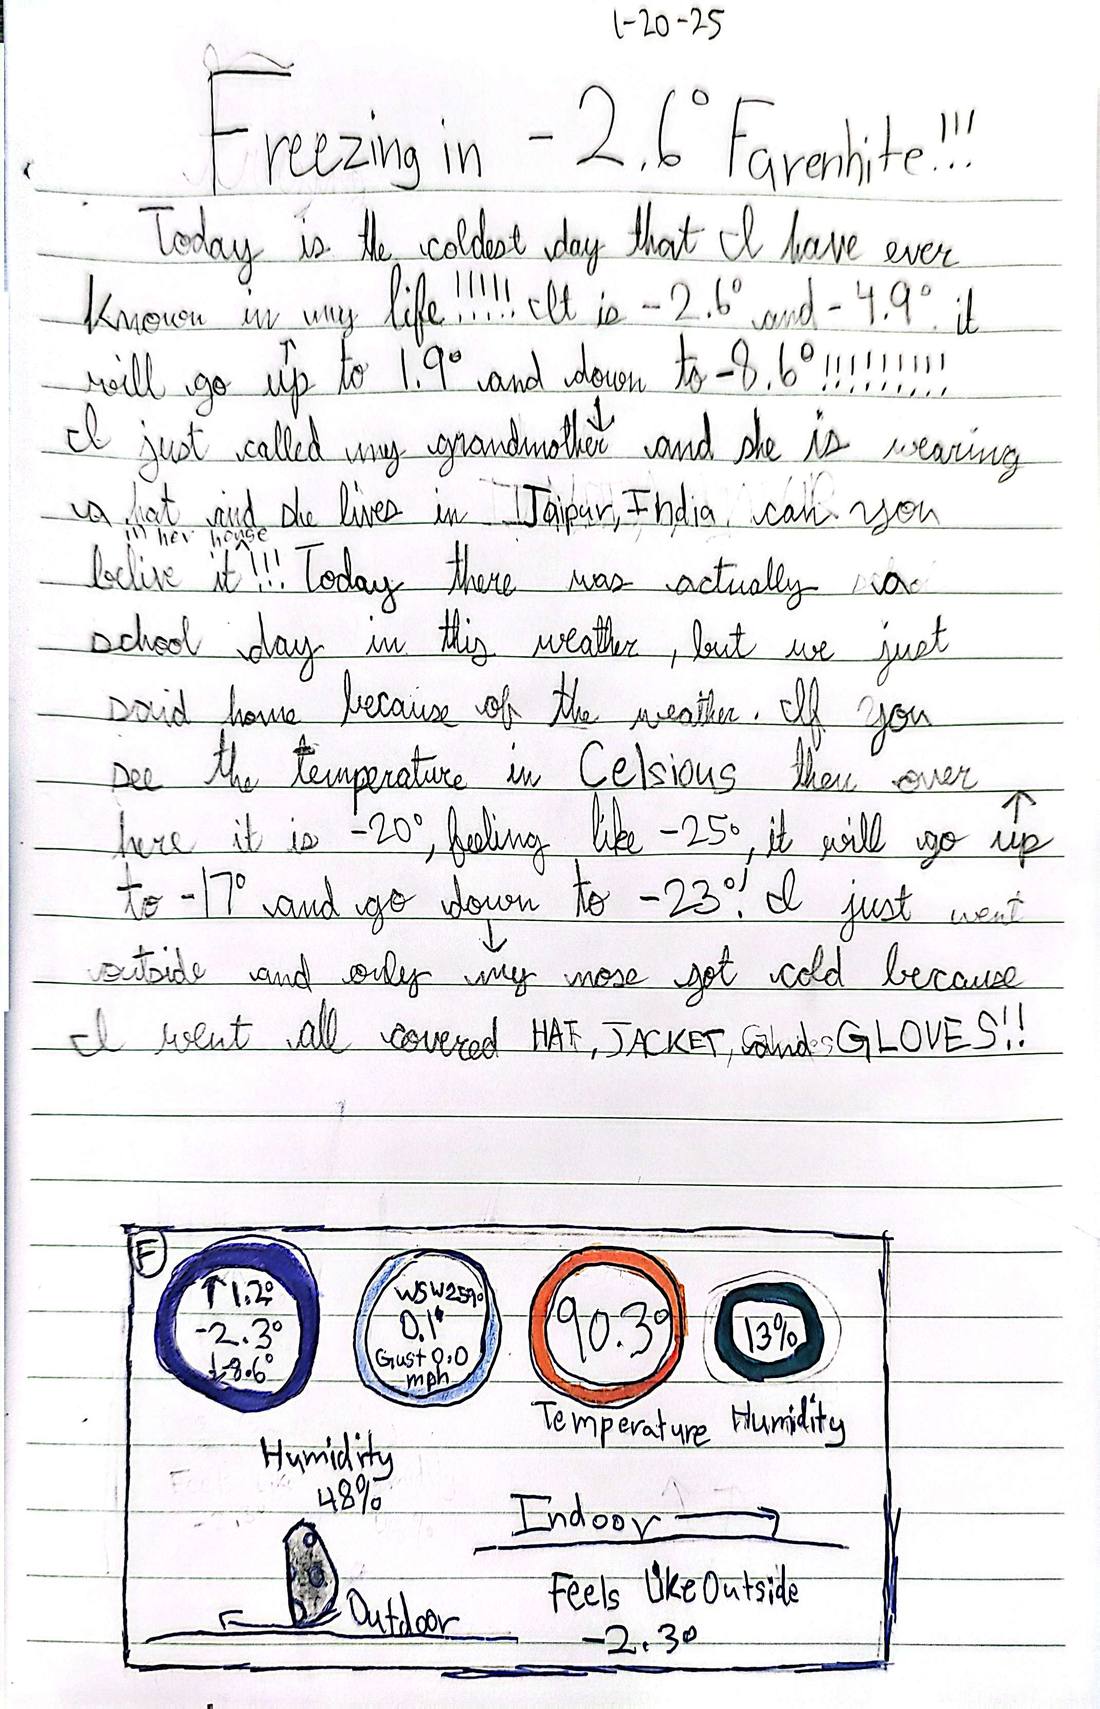
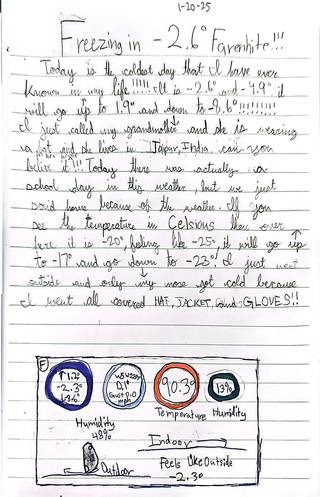 Freezing in −2.6° Fahrenheit!!!Jan 20, 2025
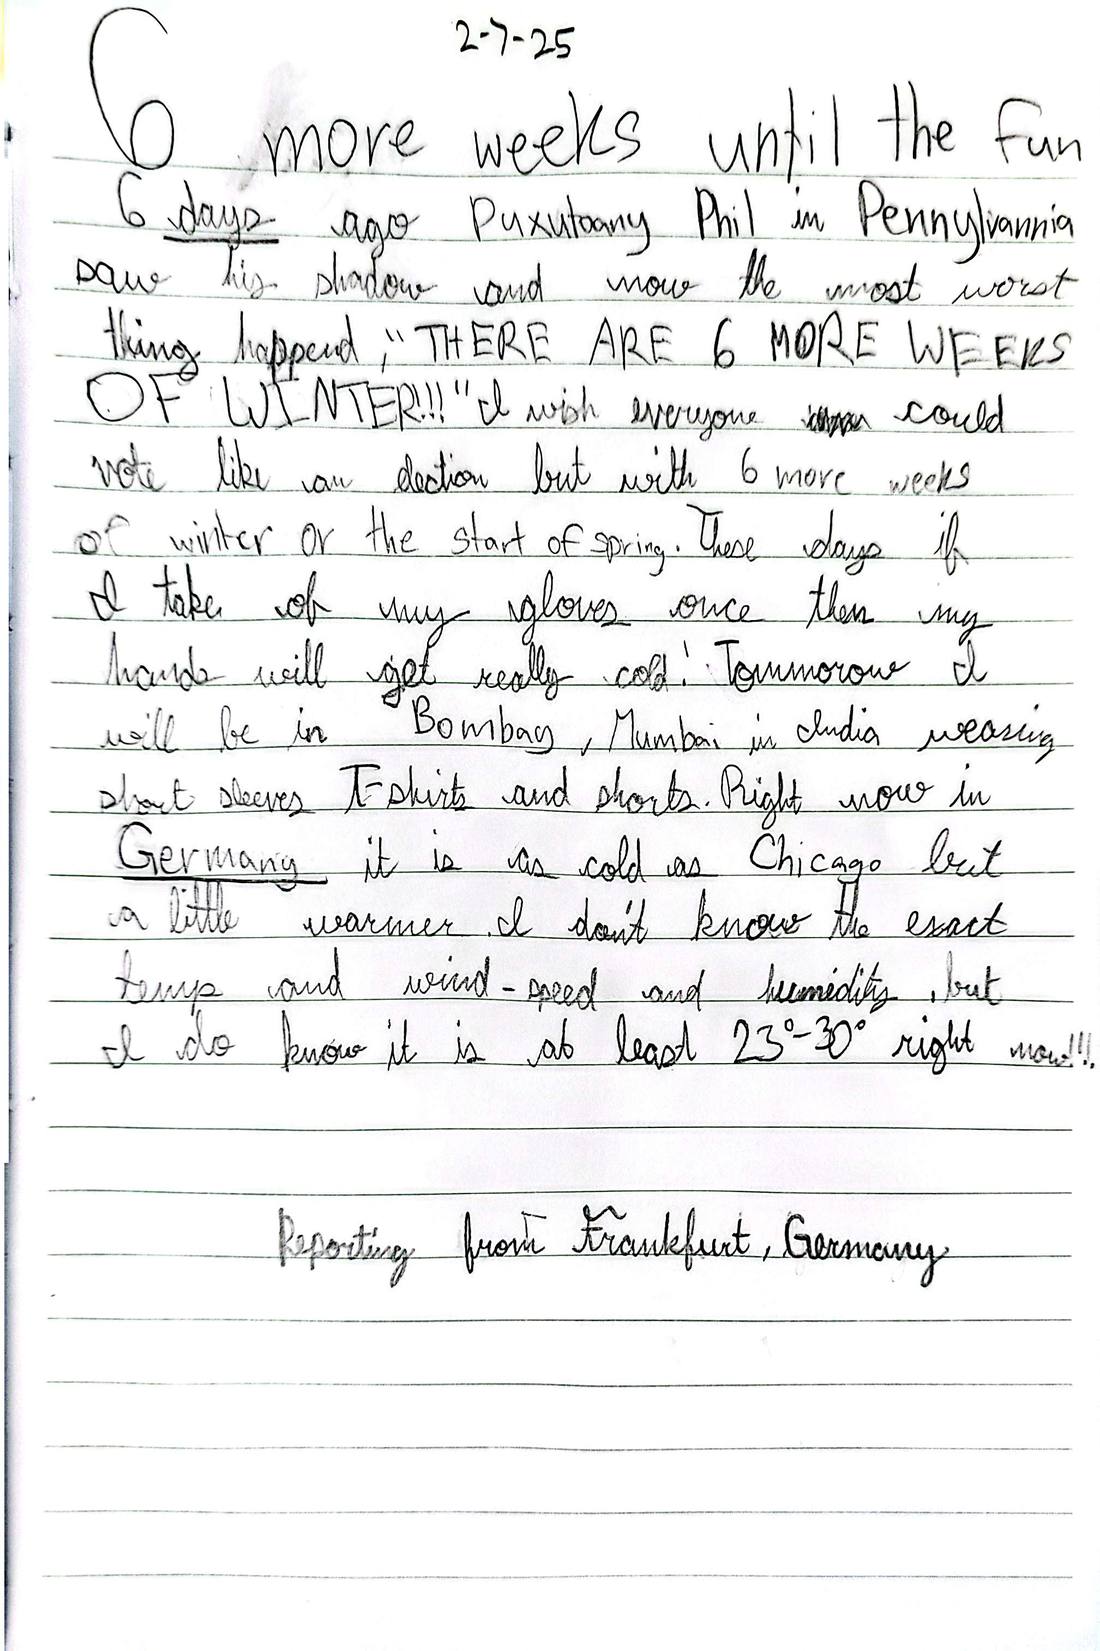
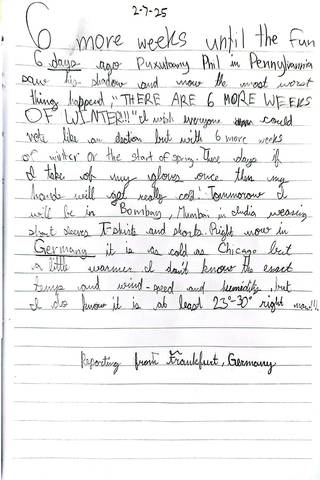 6 more weeks until the funFeb 7, 2025
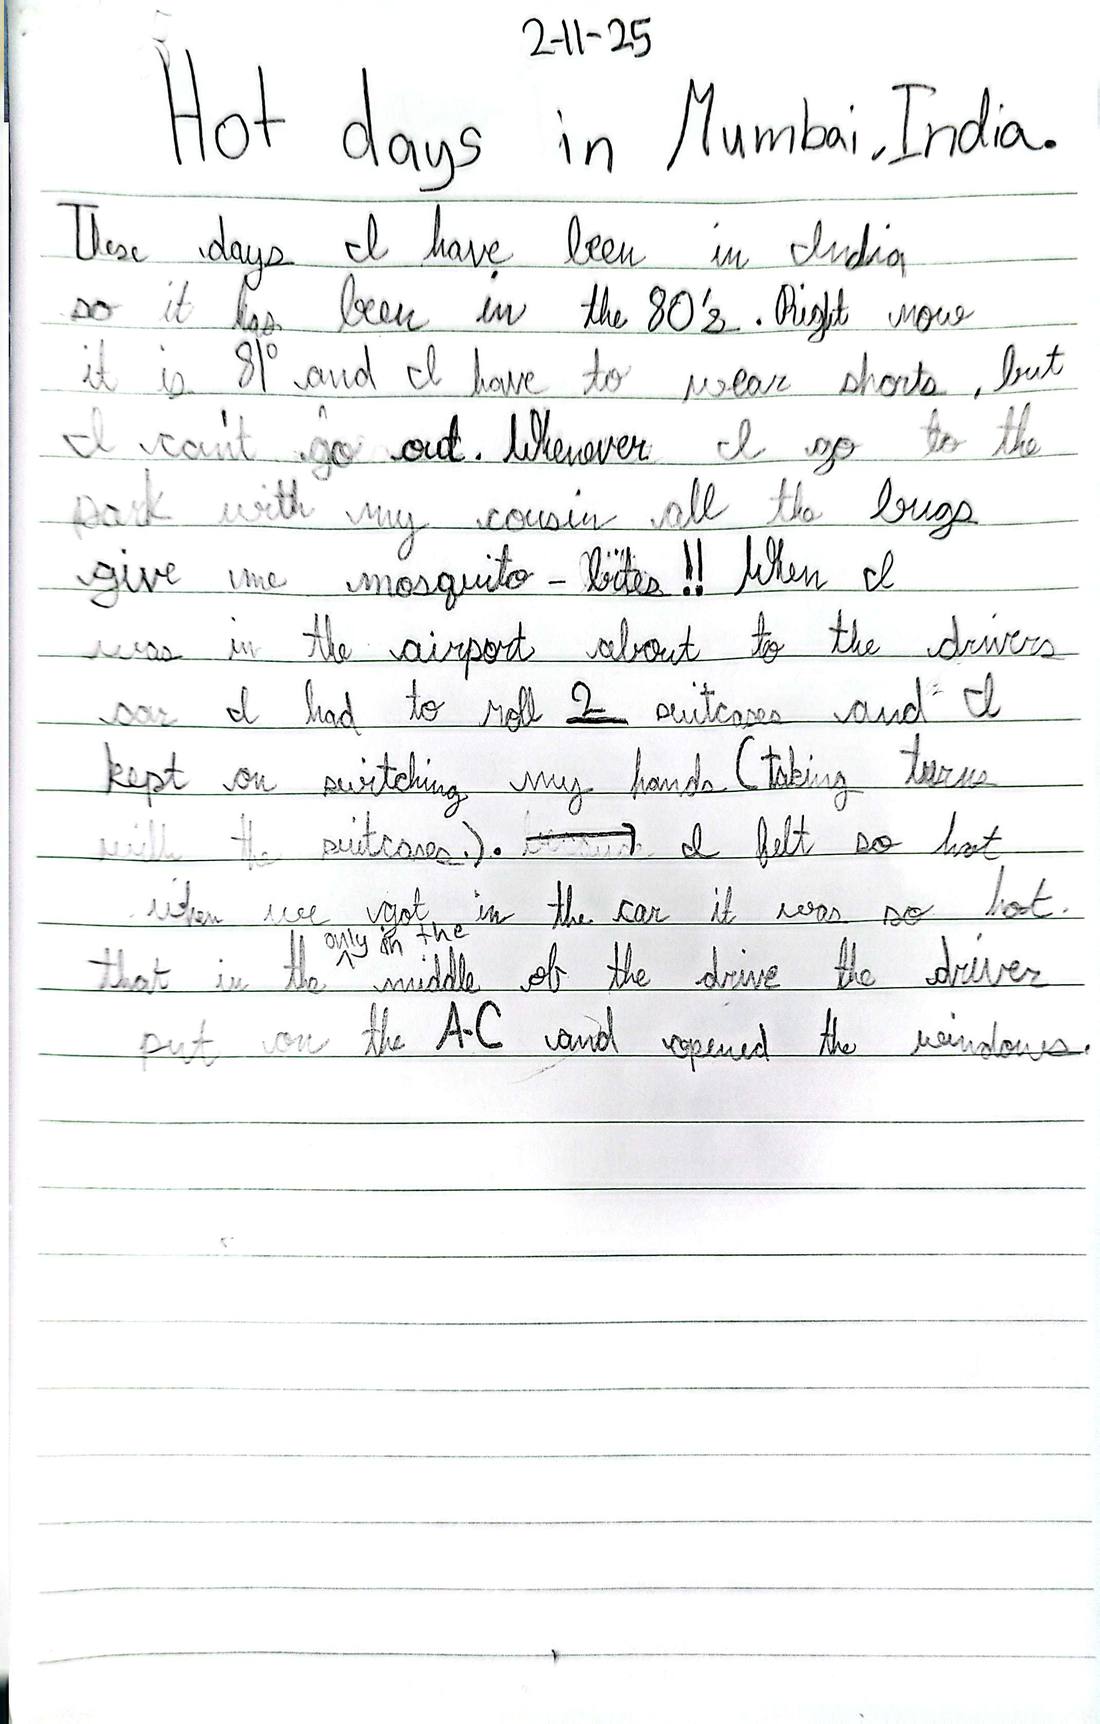
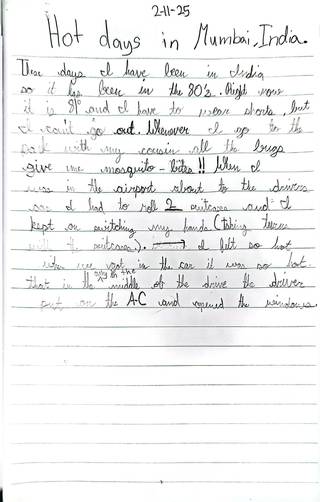 Hot days in Mumbai, IndiaFeb 11, 2025
Spring 2025 19 pages
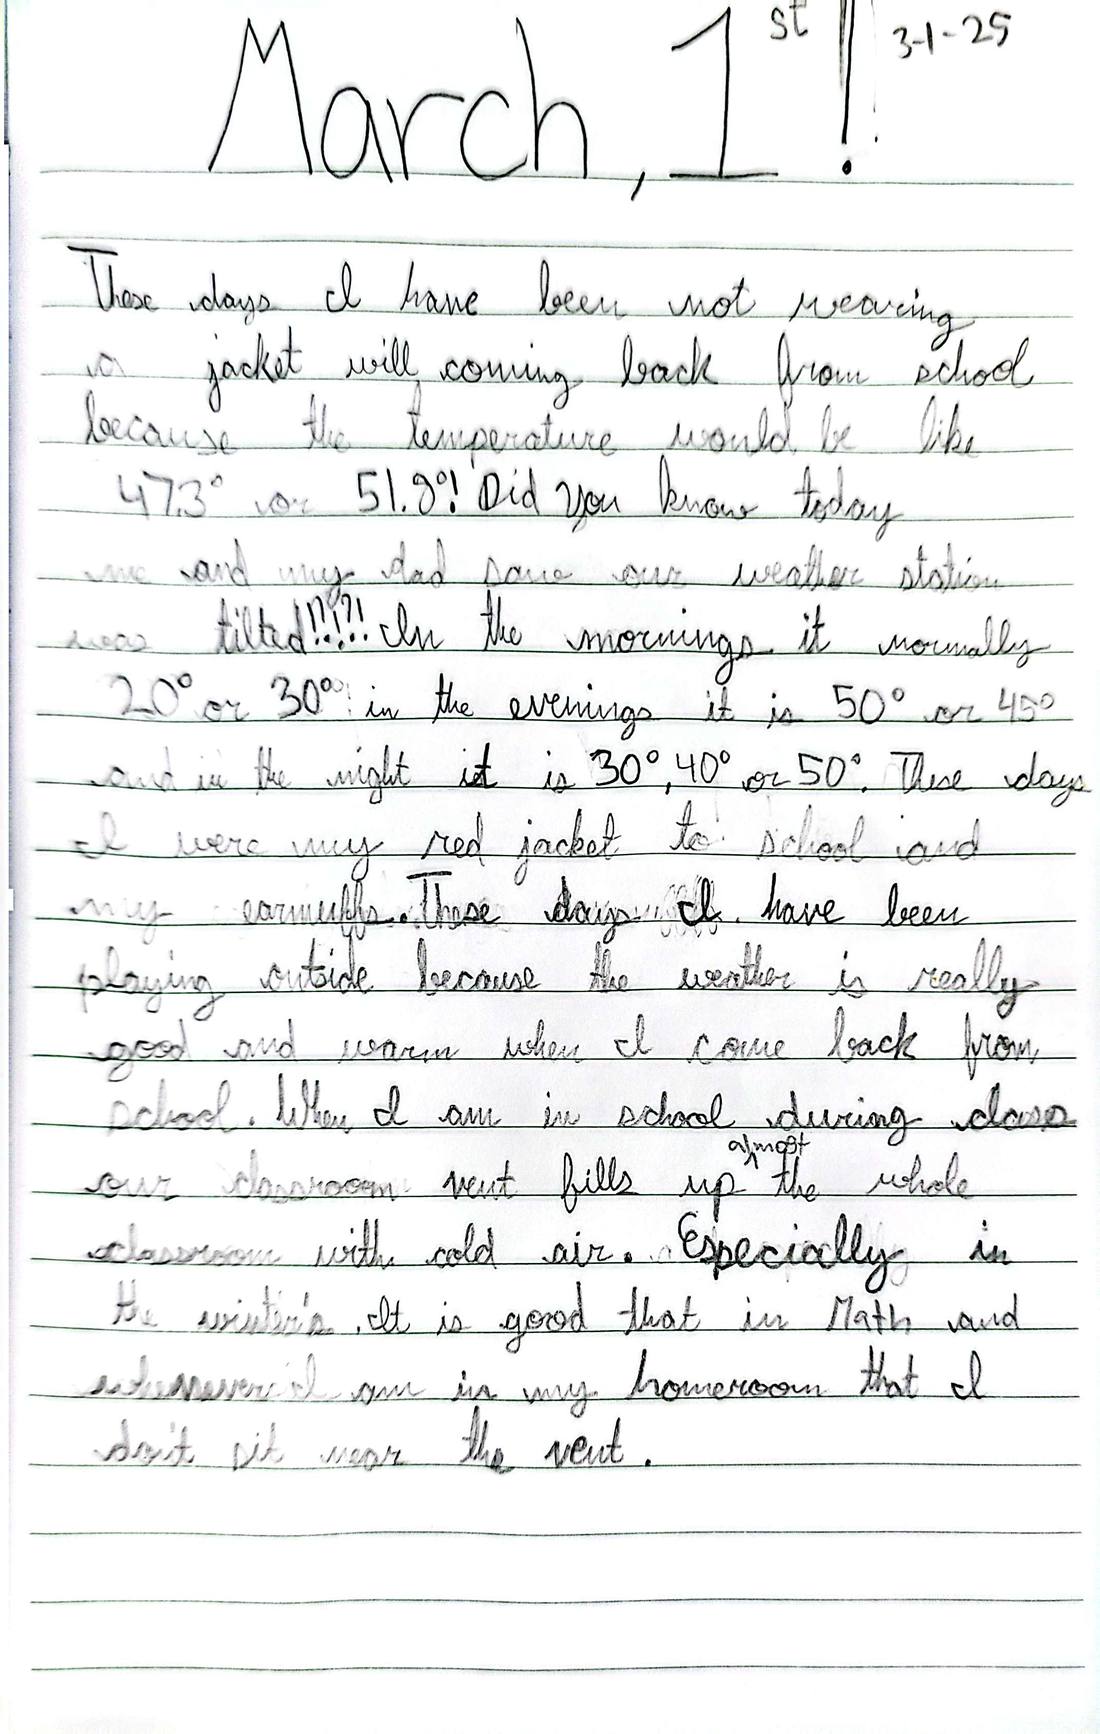
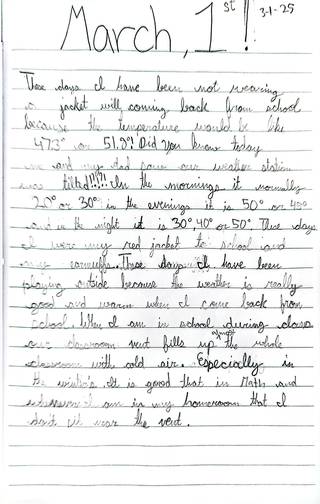 March 1st!Mar 1, 2025
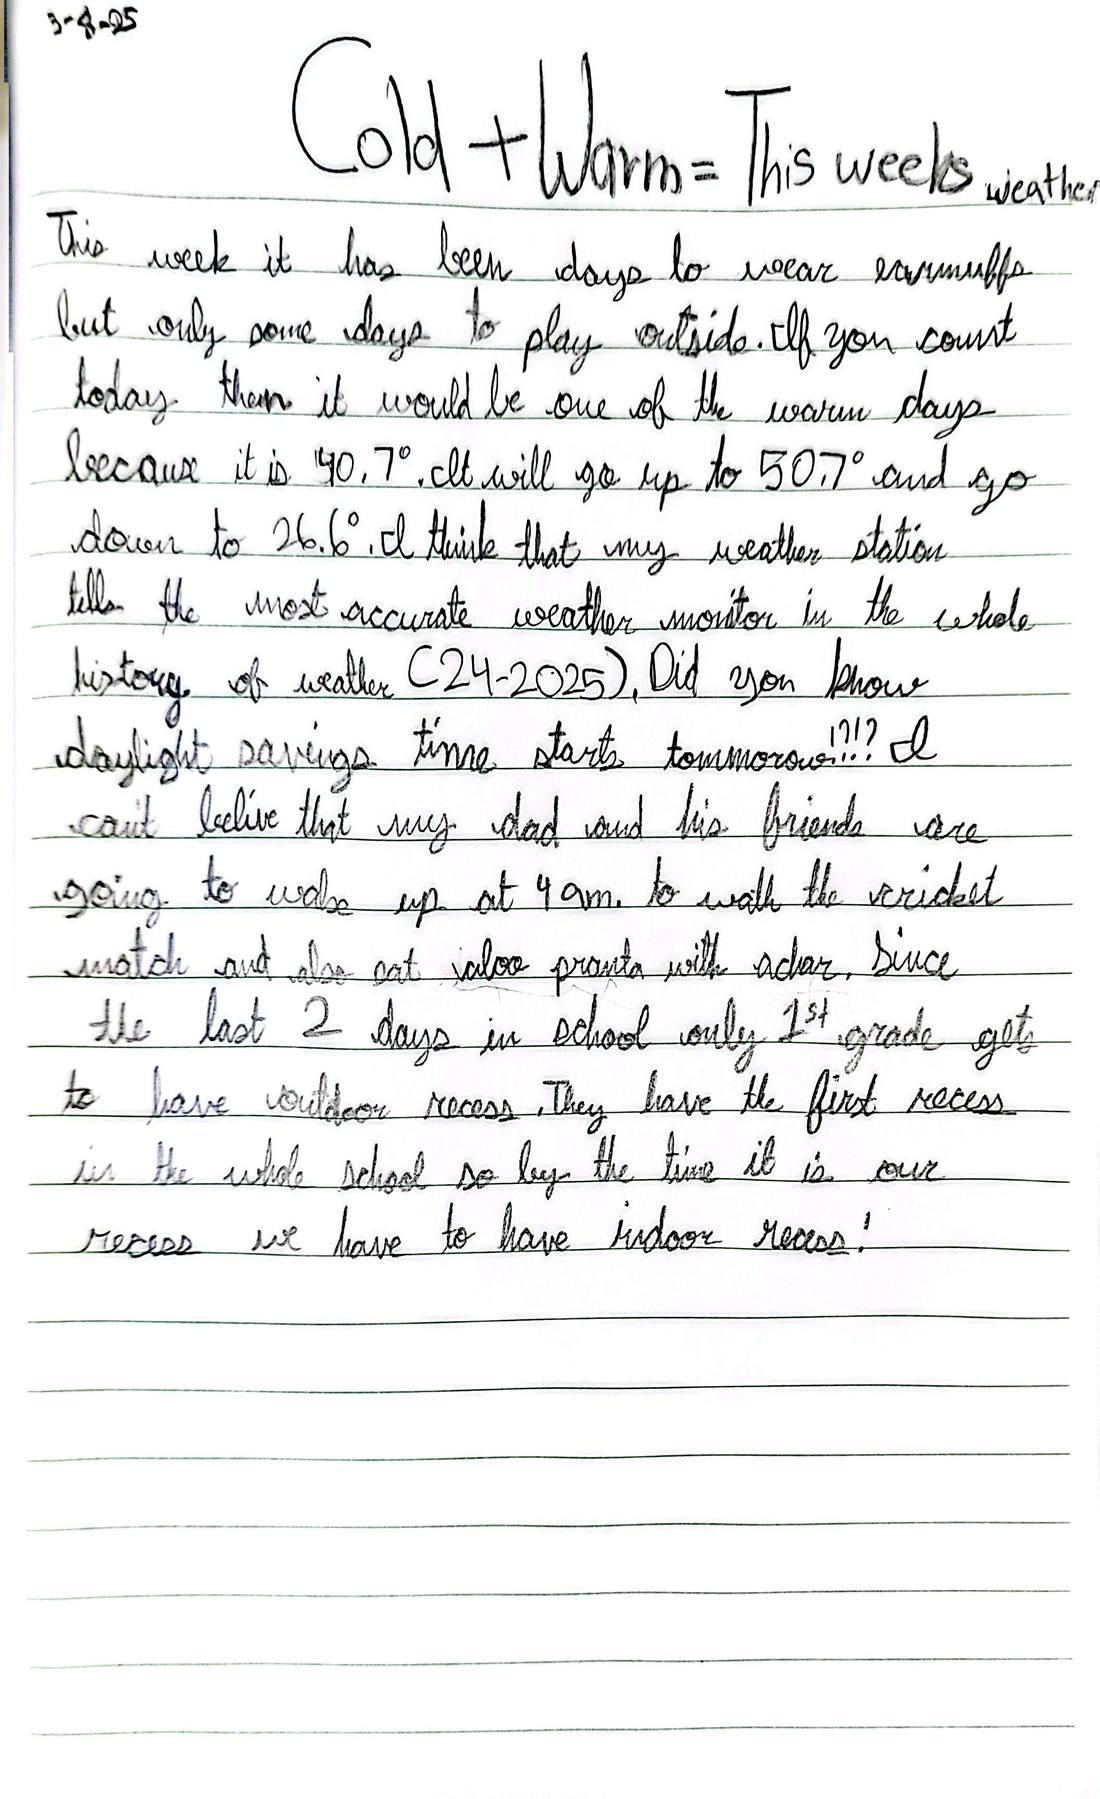
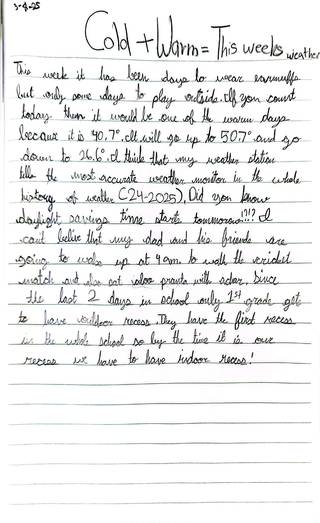 Cold + warm = this week's weatherMar 8, 2025
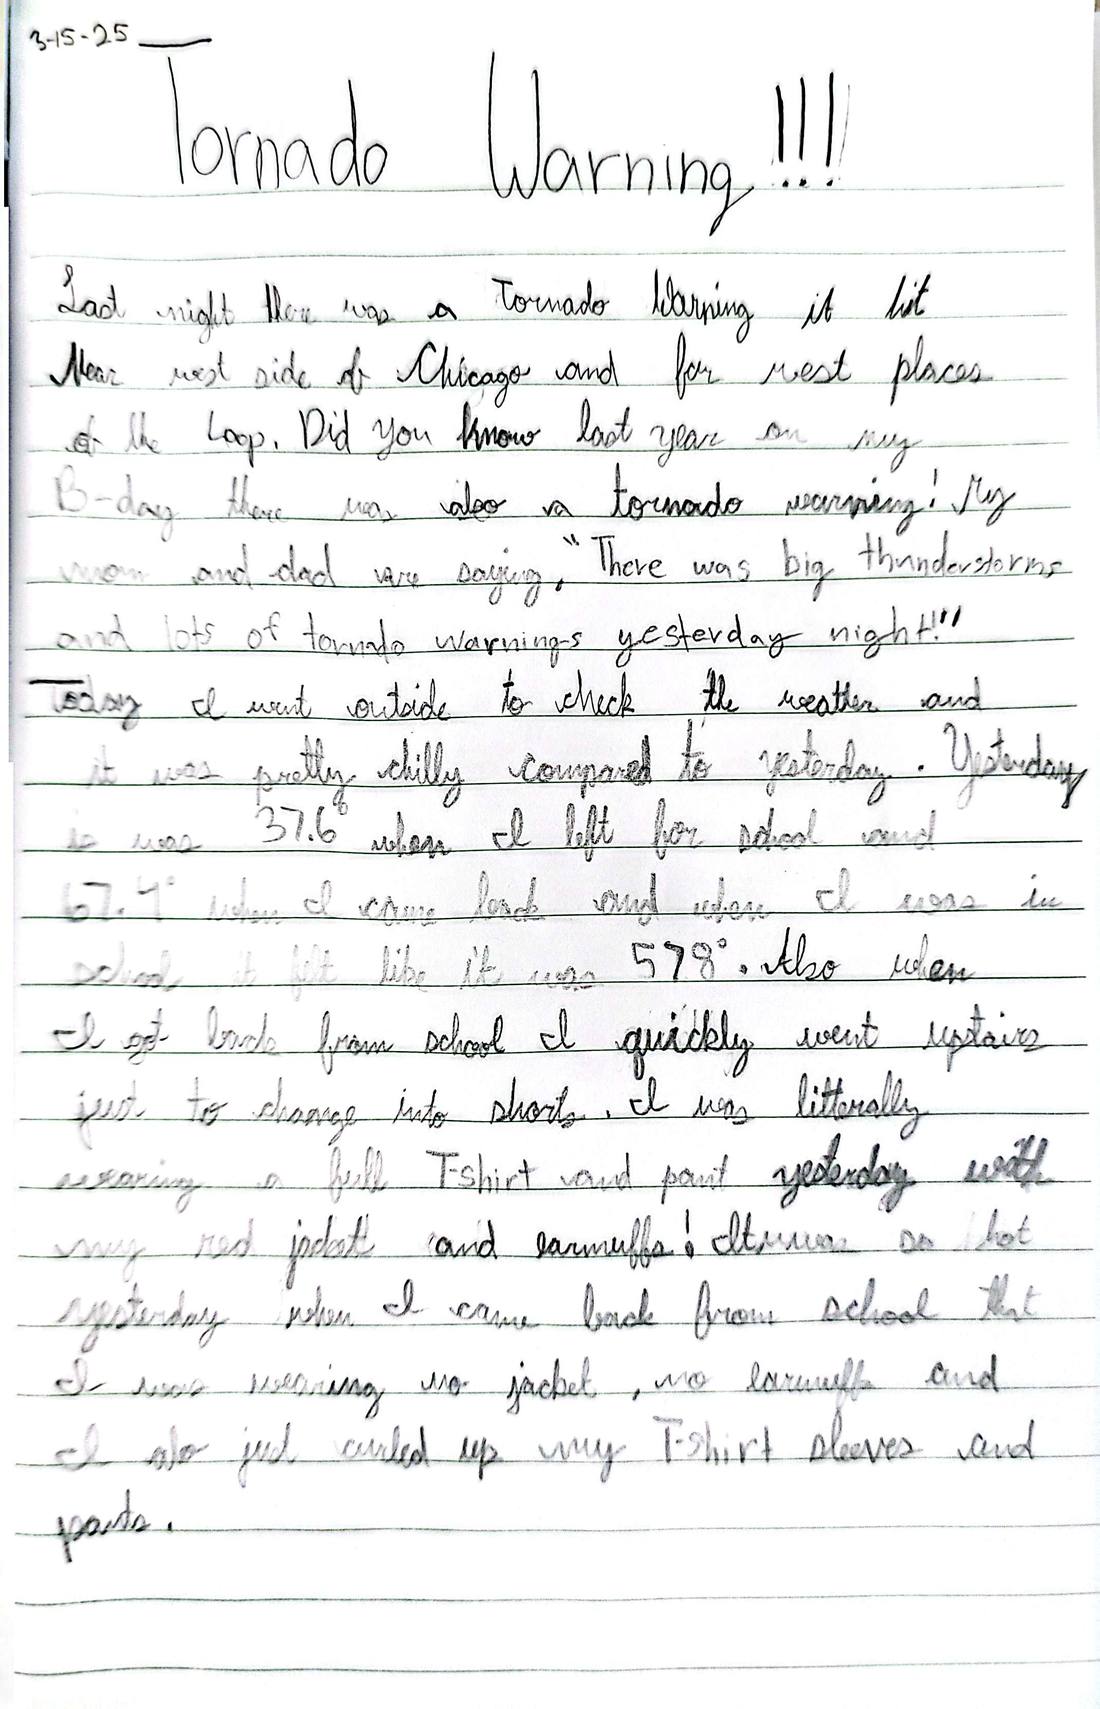
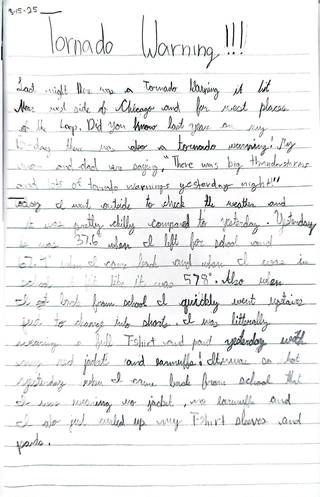 Tornado warning!!!Mar 15, 2025
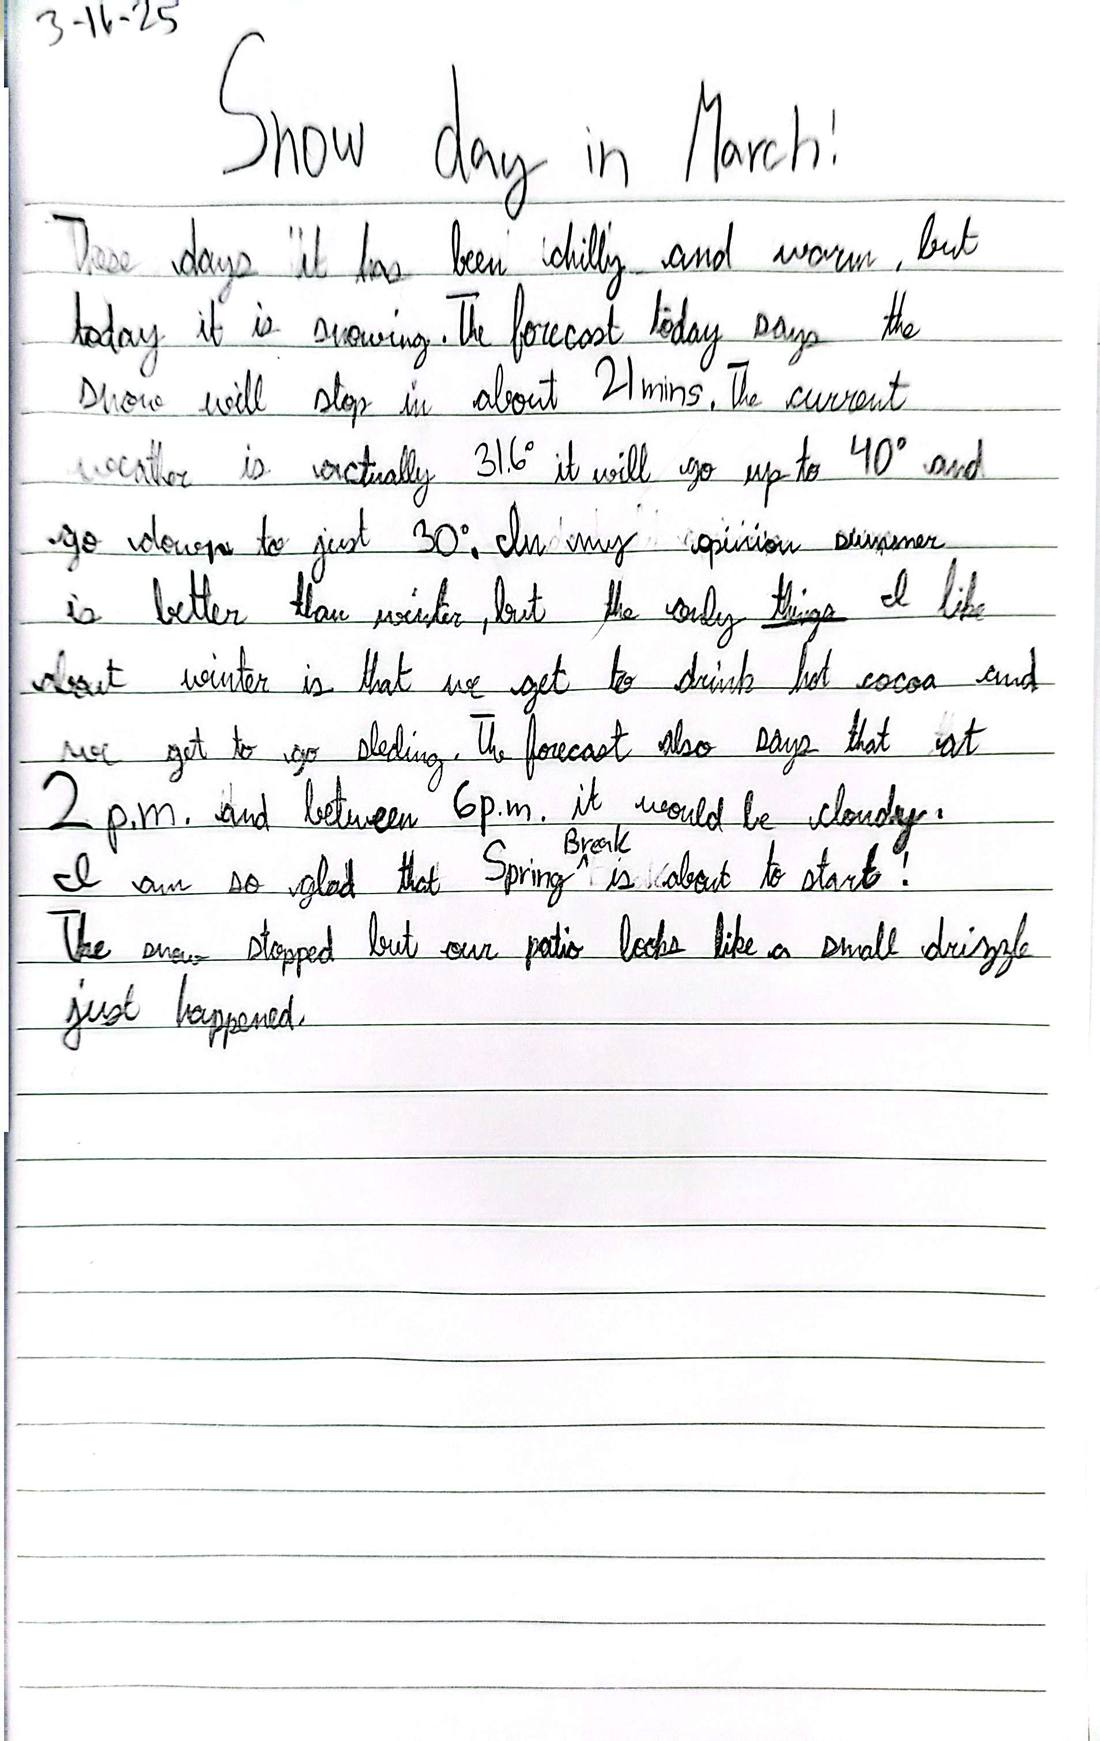
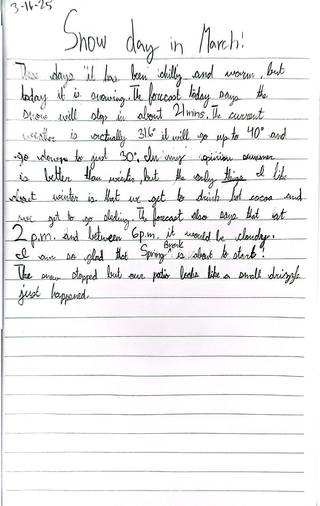 Snow day in March!Mar 16, 2025
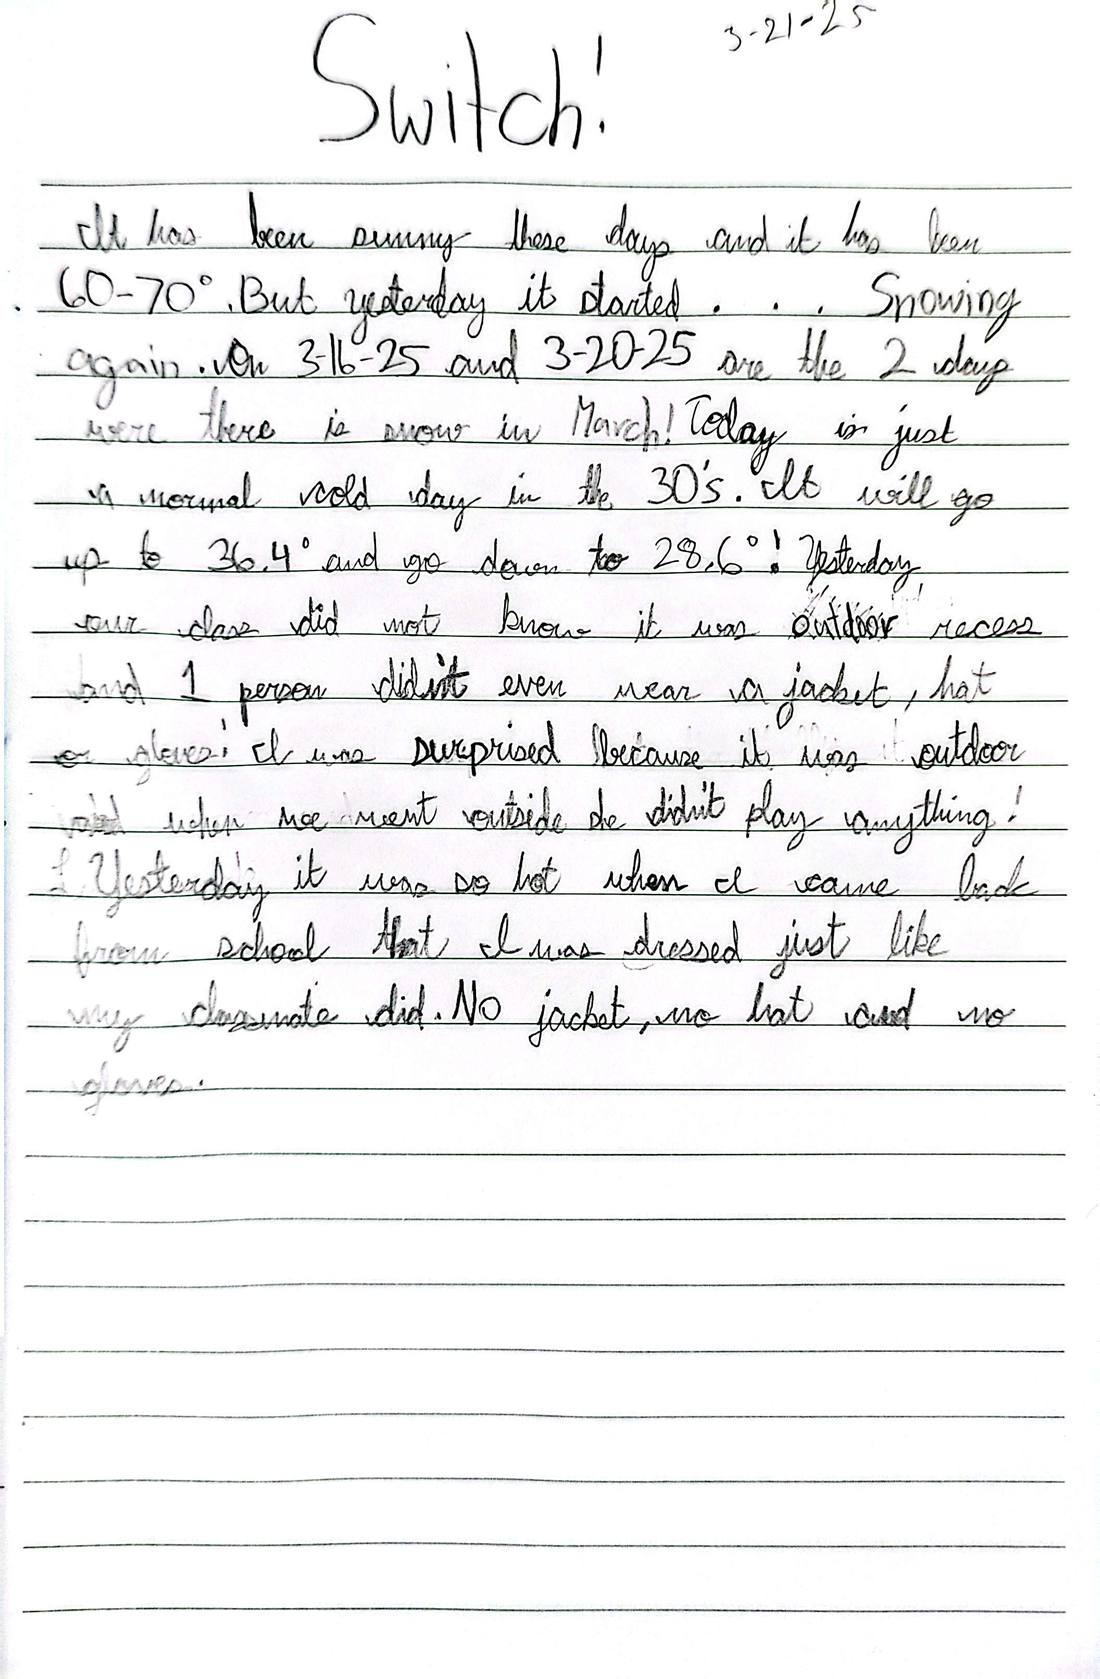
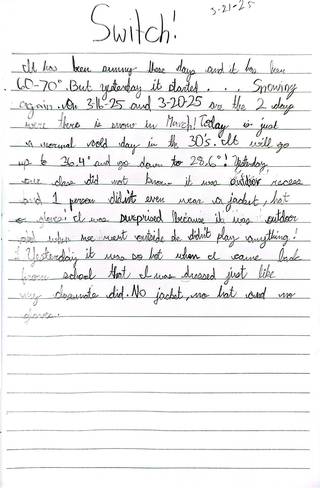 Switch!Mar 21, 2025
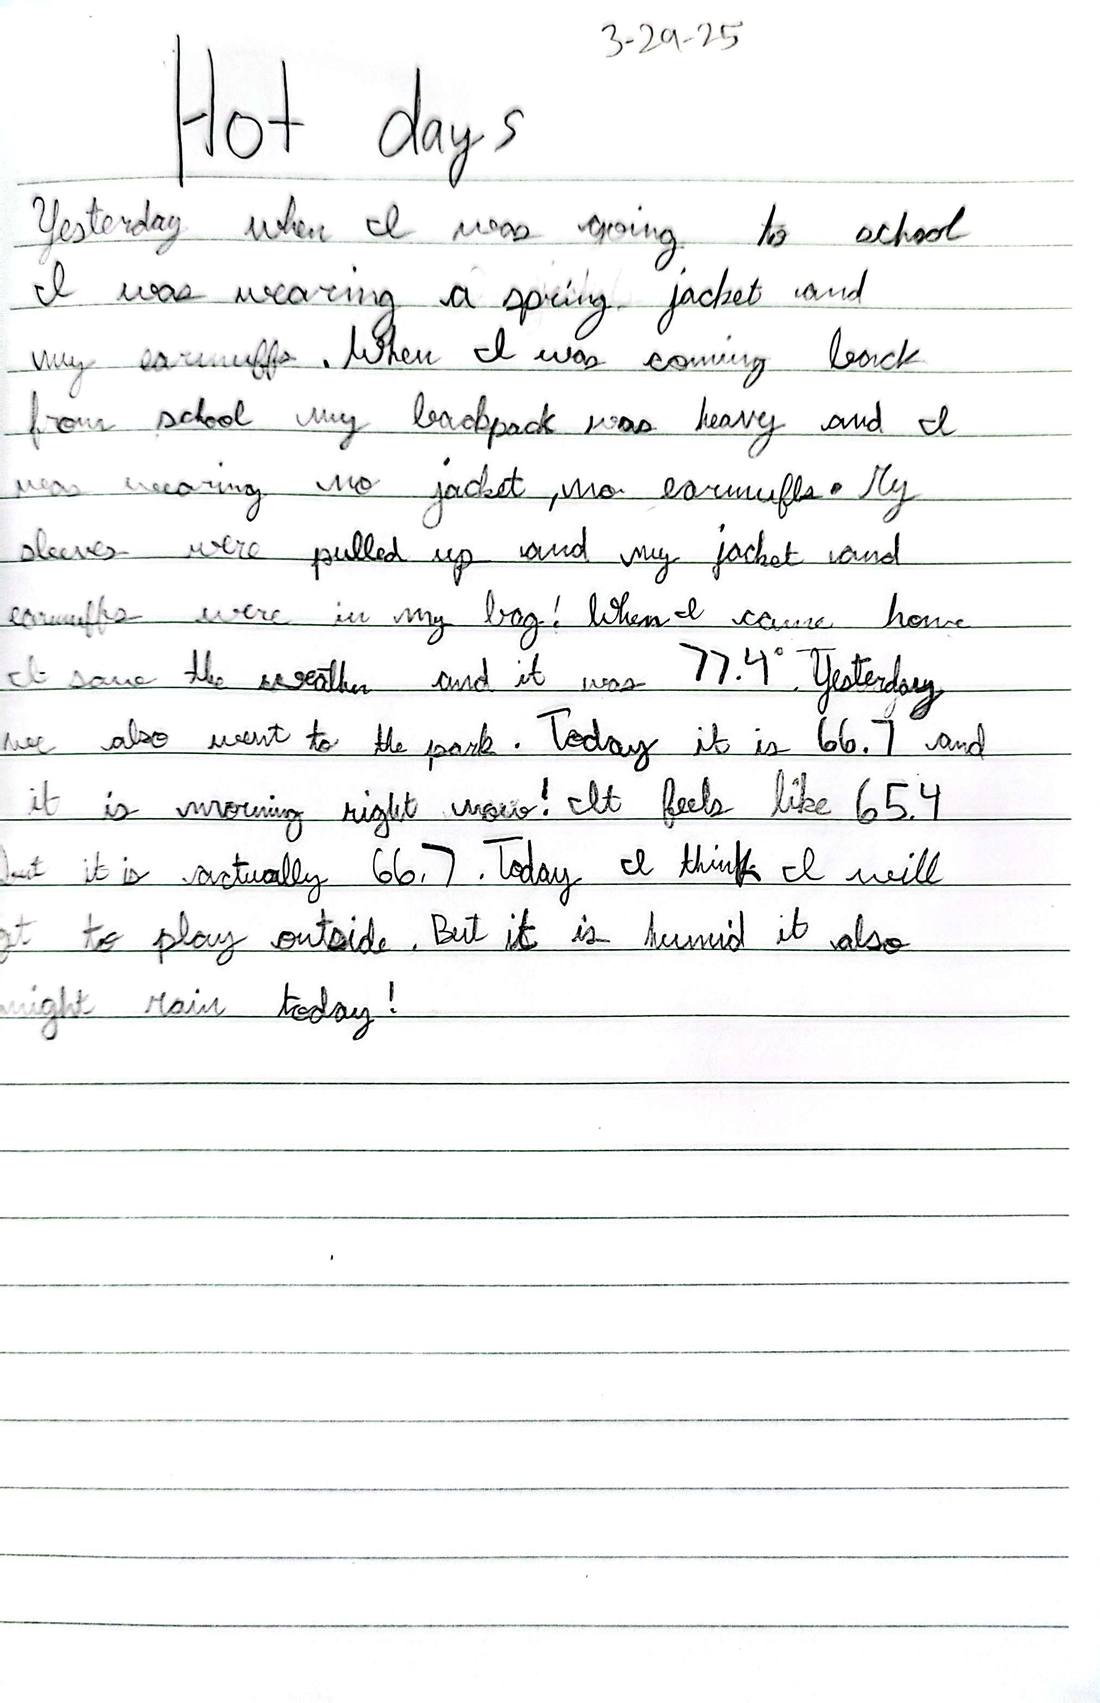
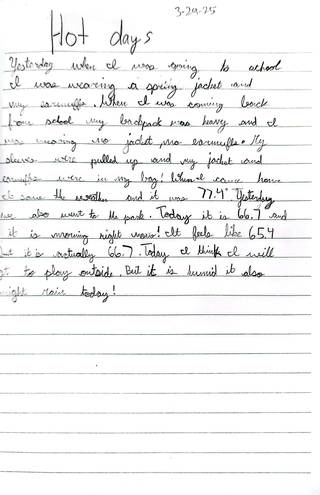 Hot daysMar 29, 2025
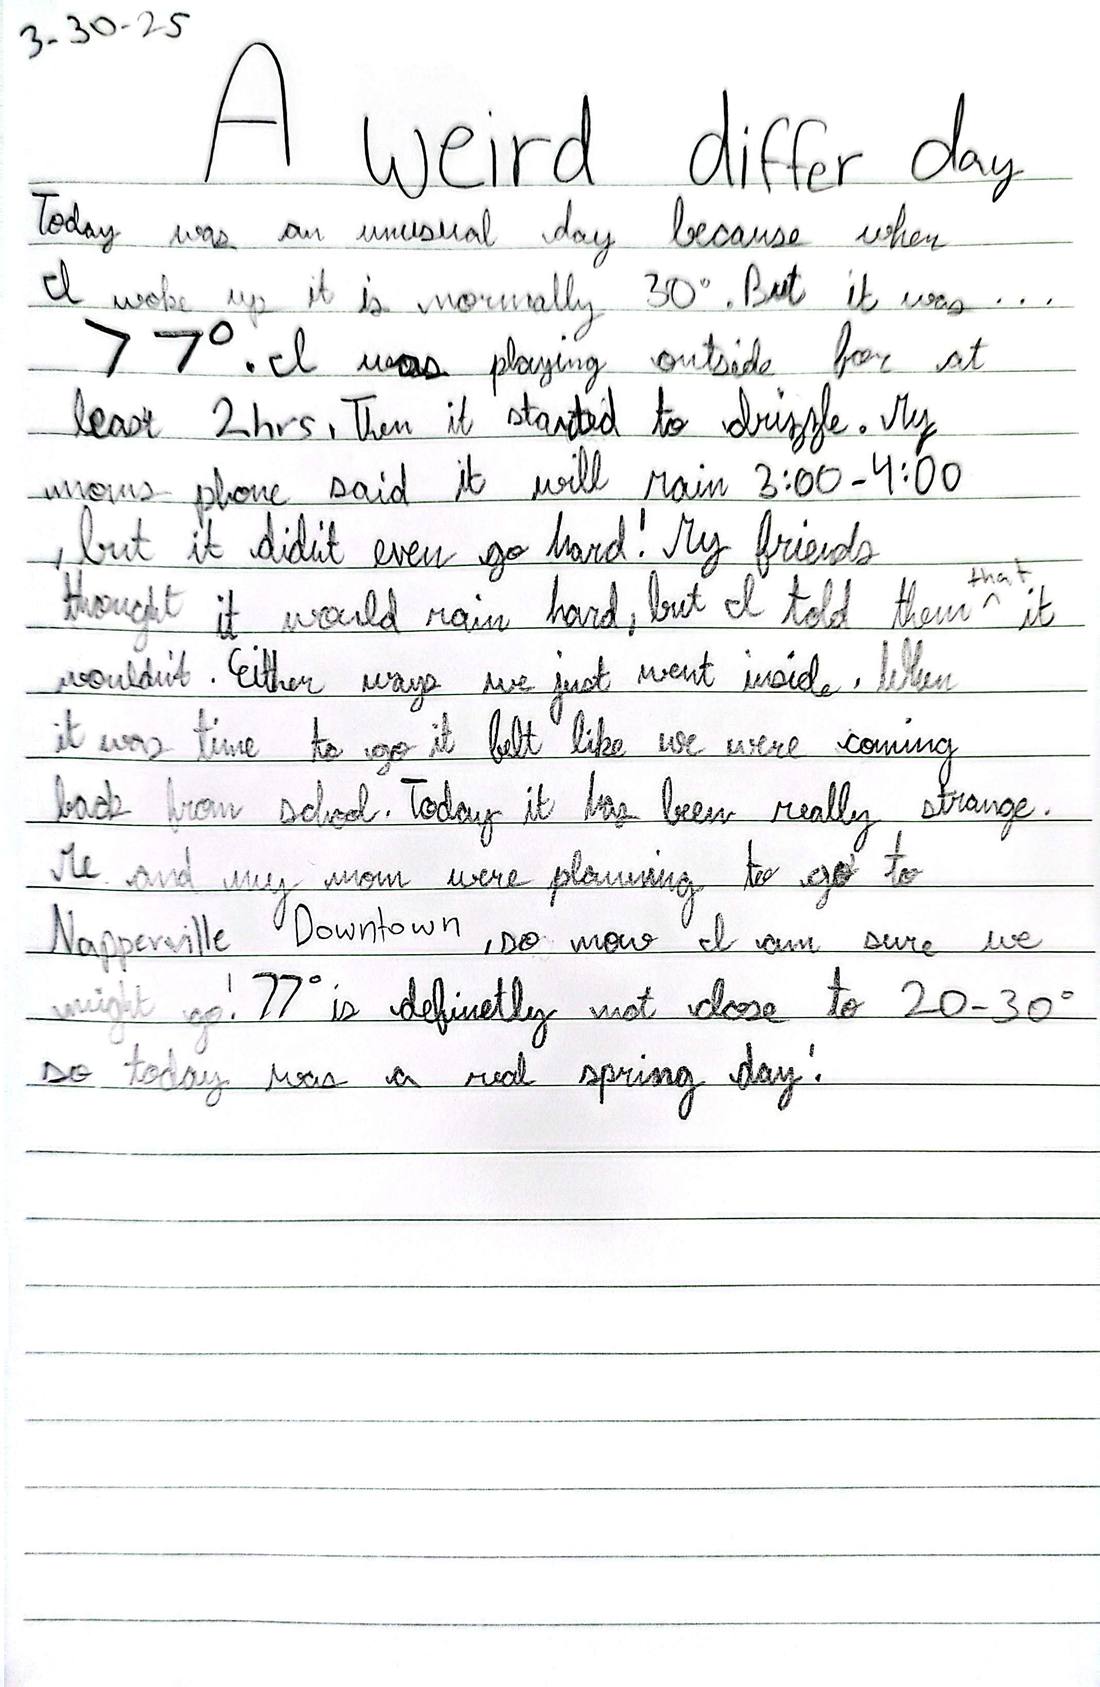
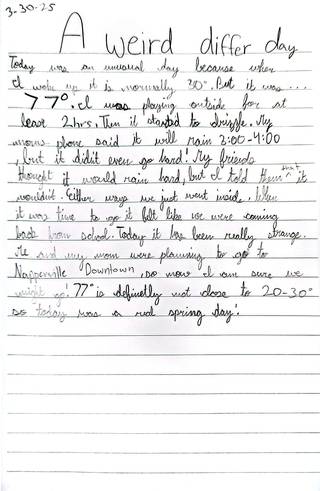 A weird differ dayMar 30, 2025
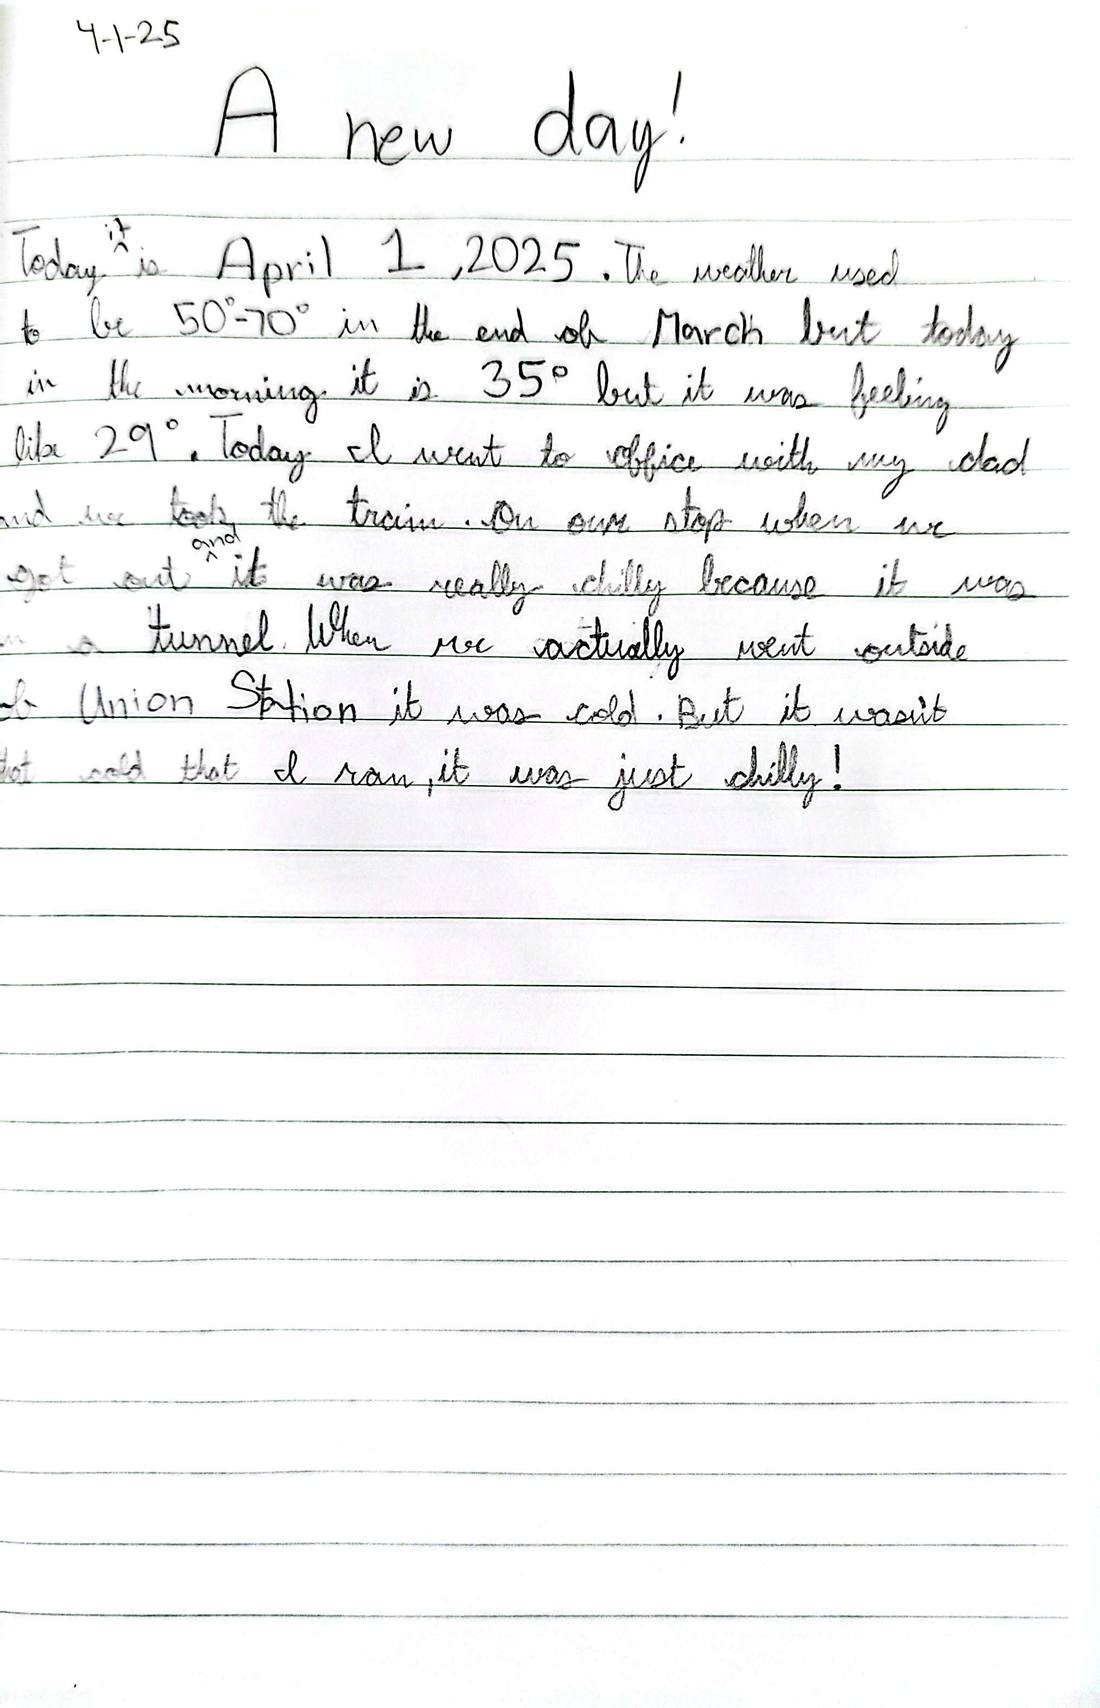
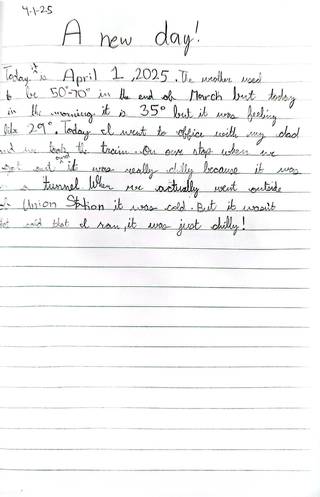 A new day!Apr 1, 2025
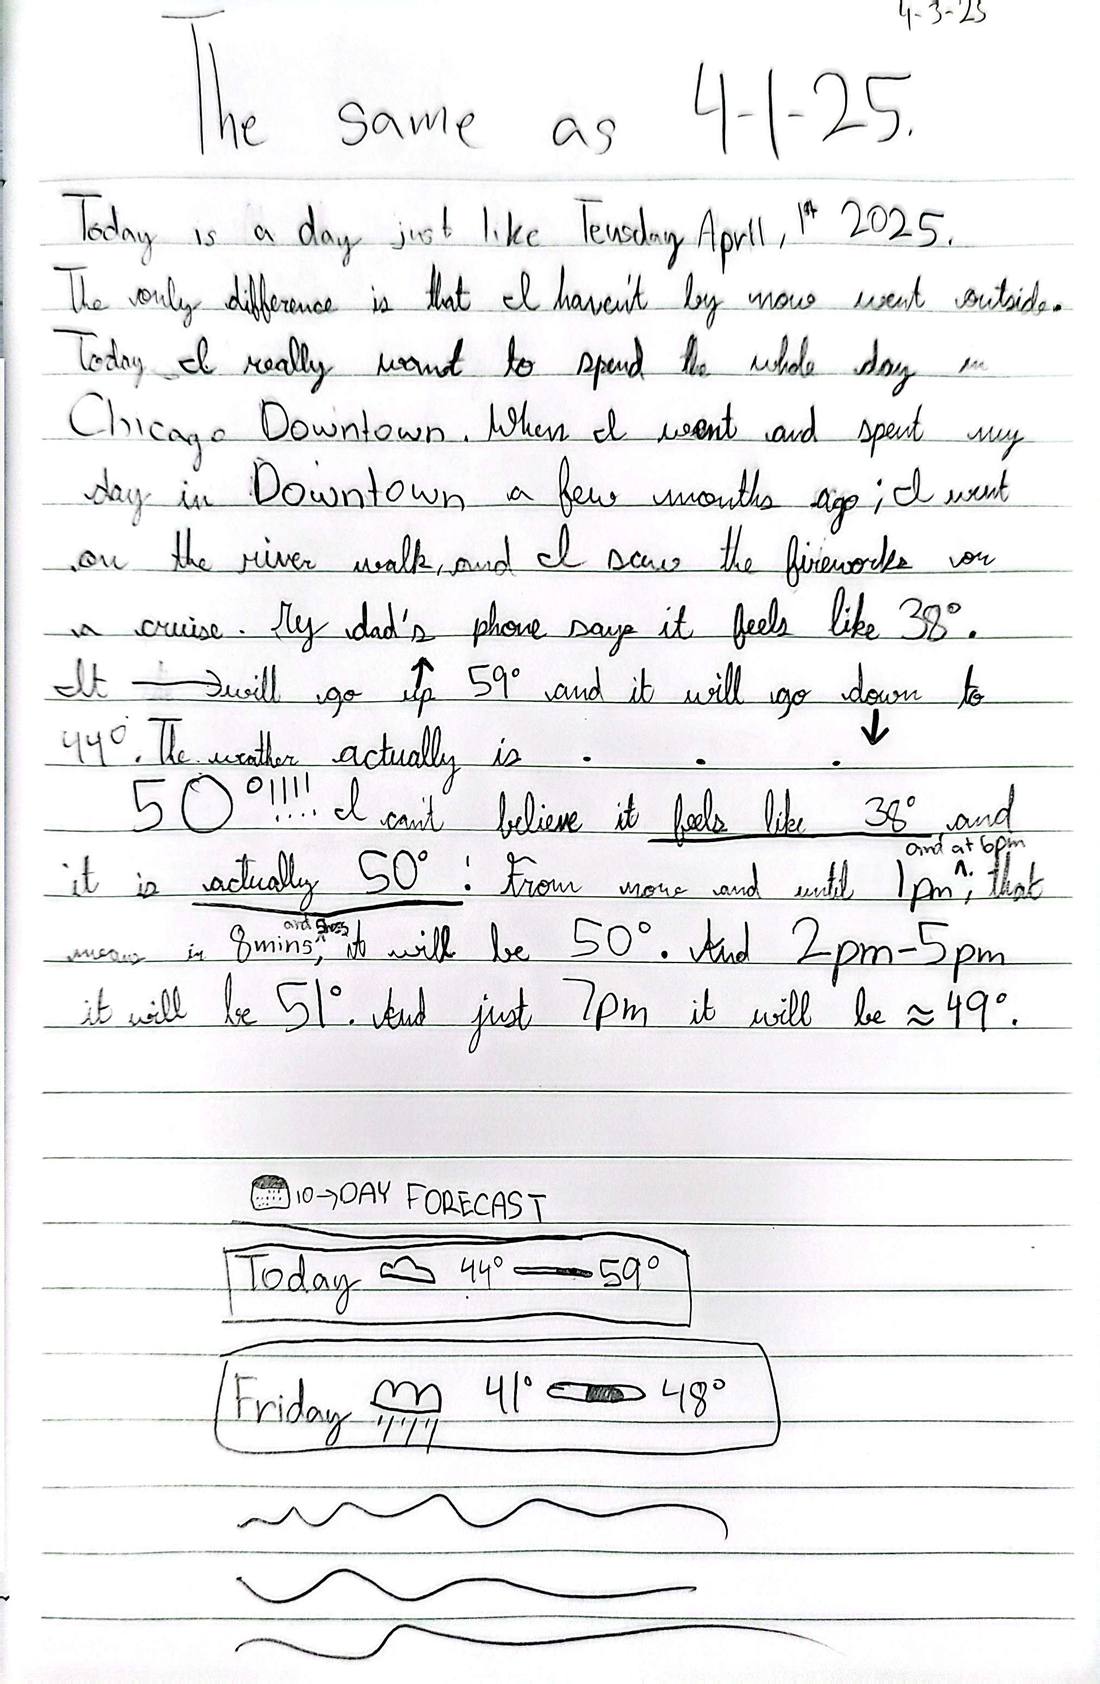
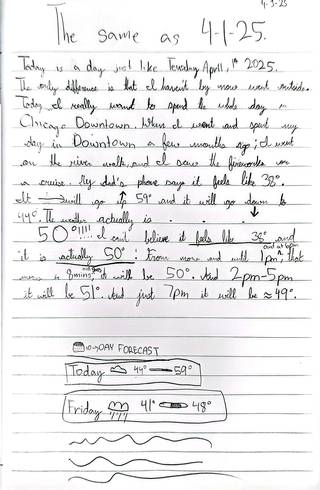 The same as 4-1-25Apr 3, 2025
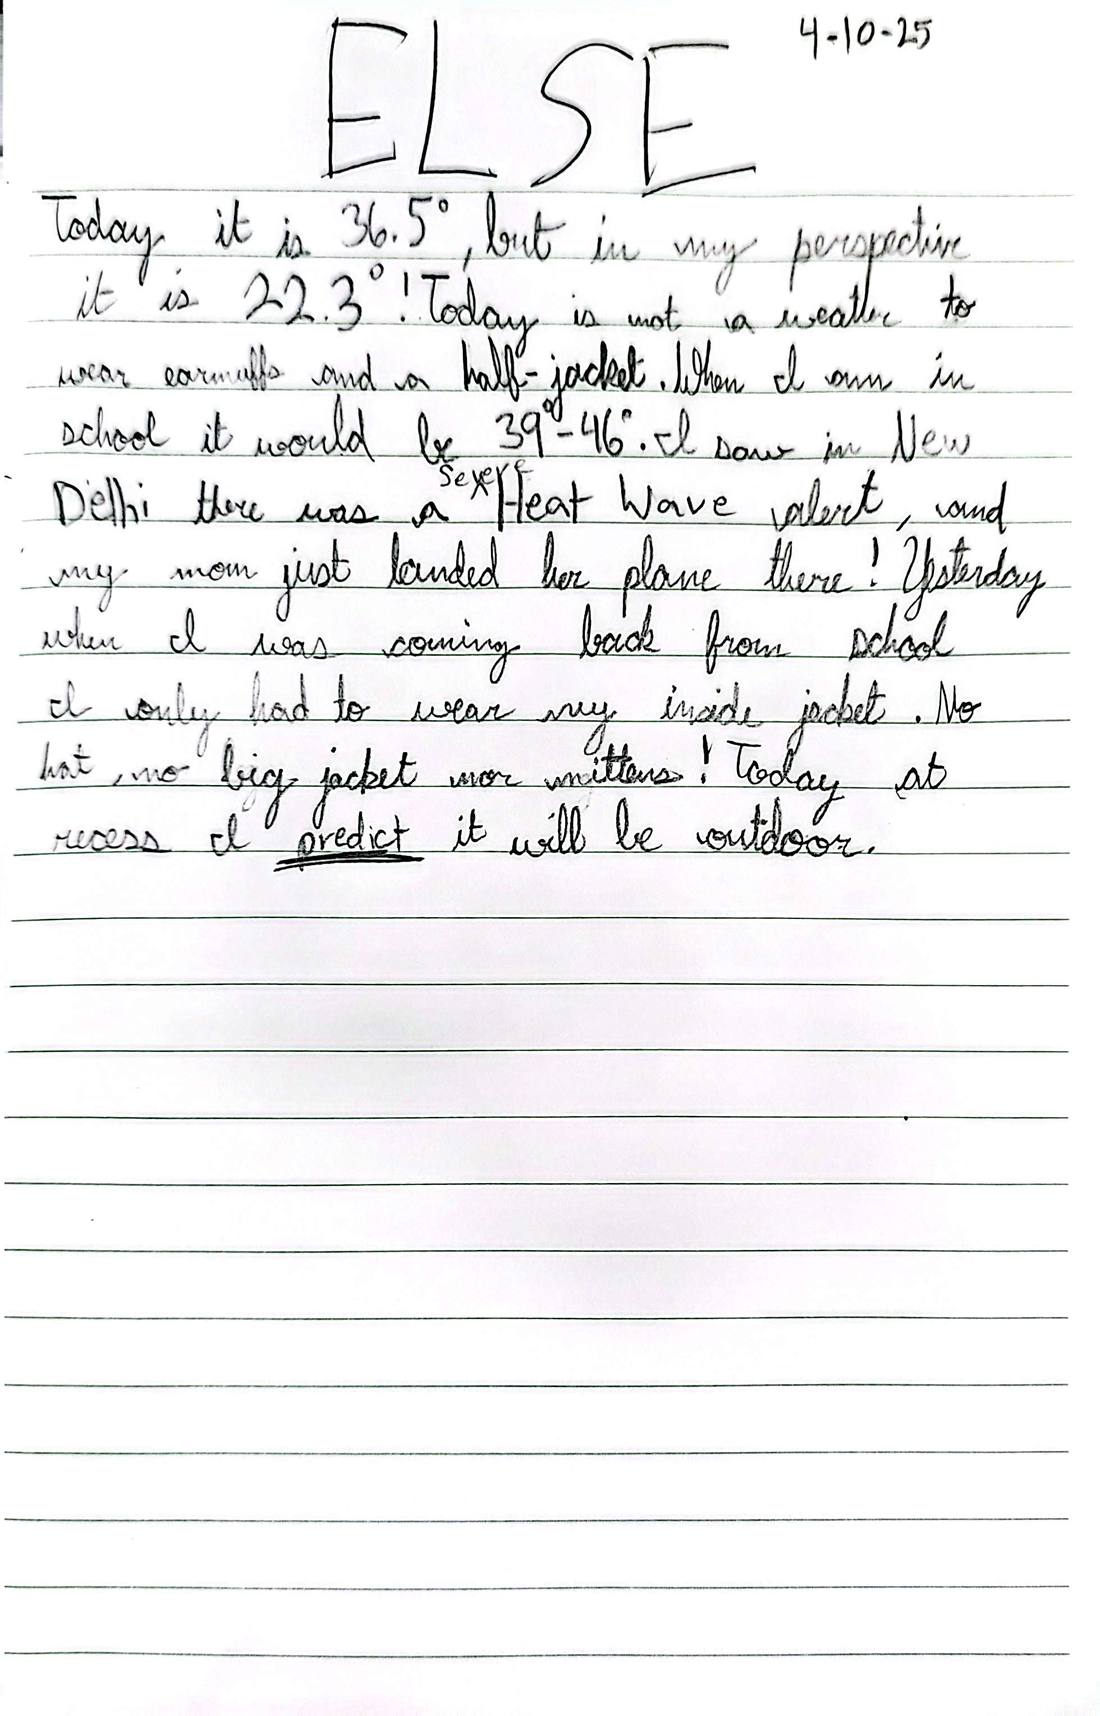
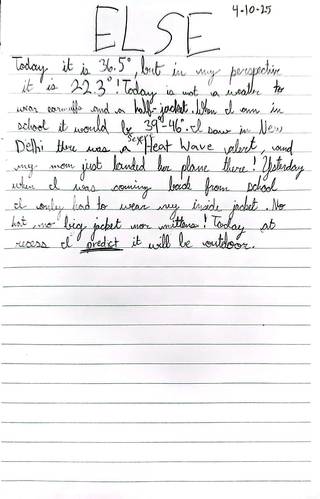 ELSEApr 10, 2025
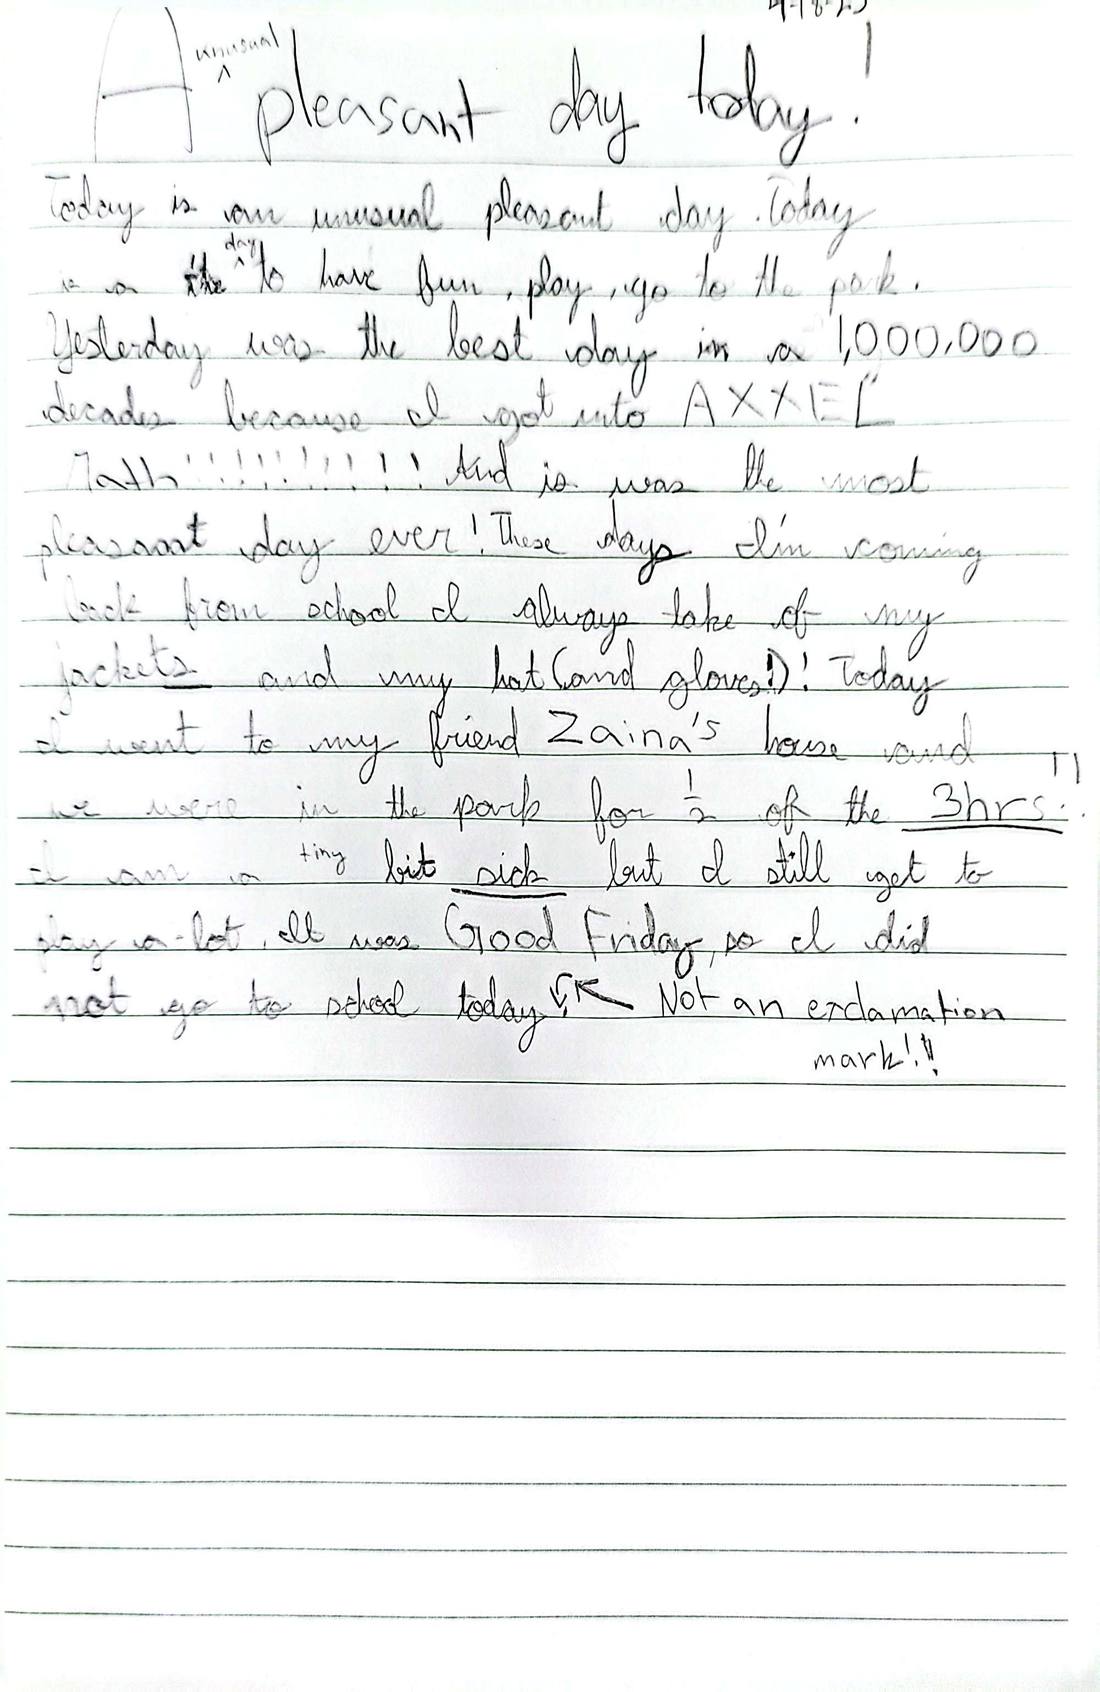
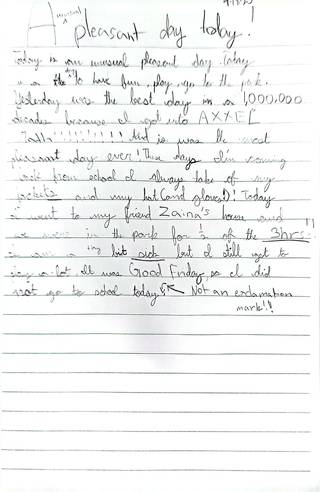 An unusual pleasant day today!Apr 18, 2025
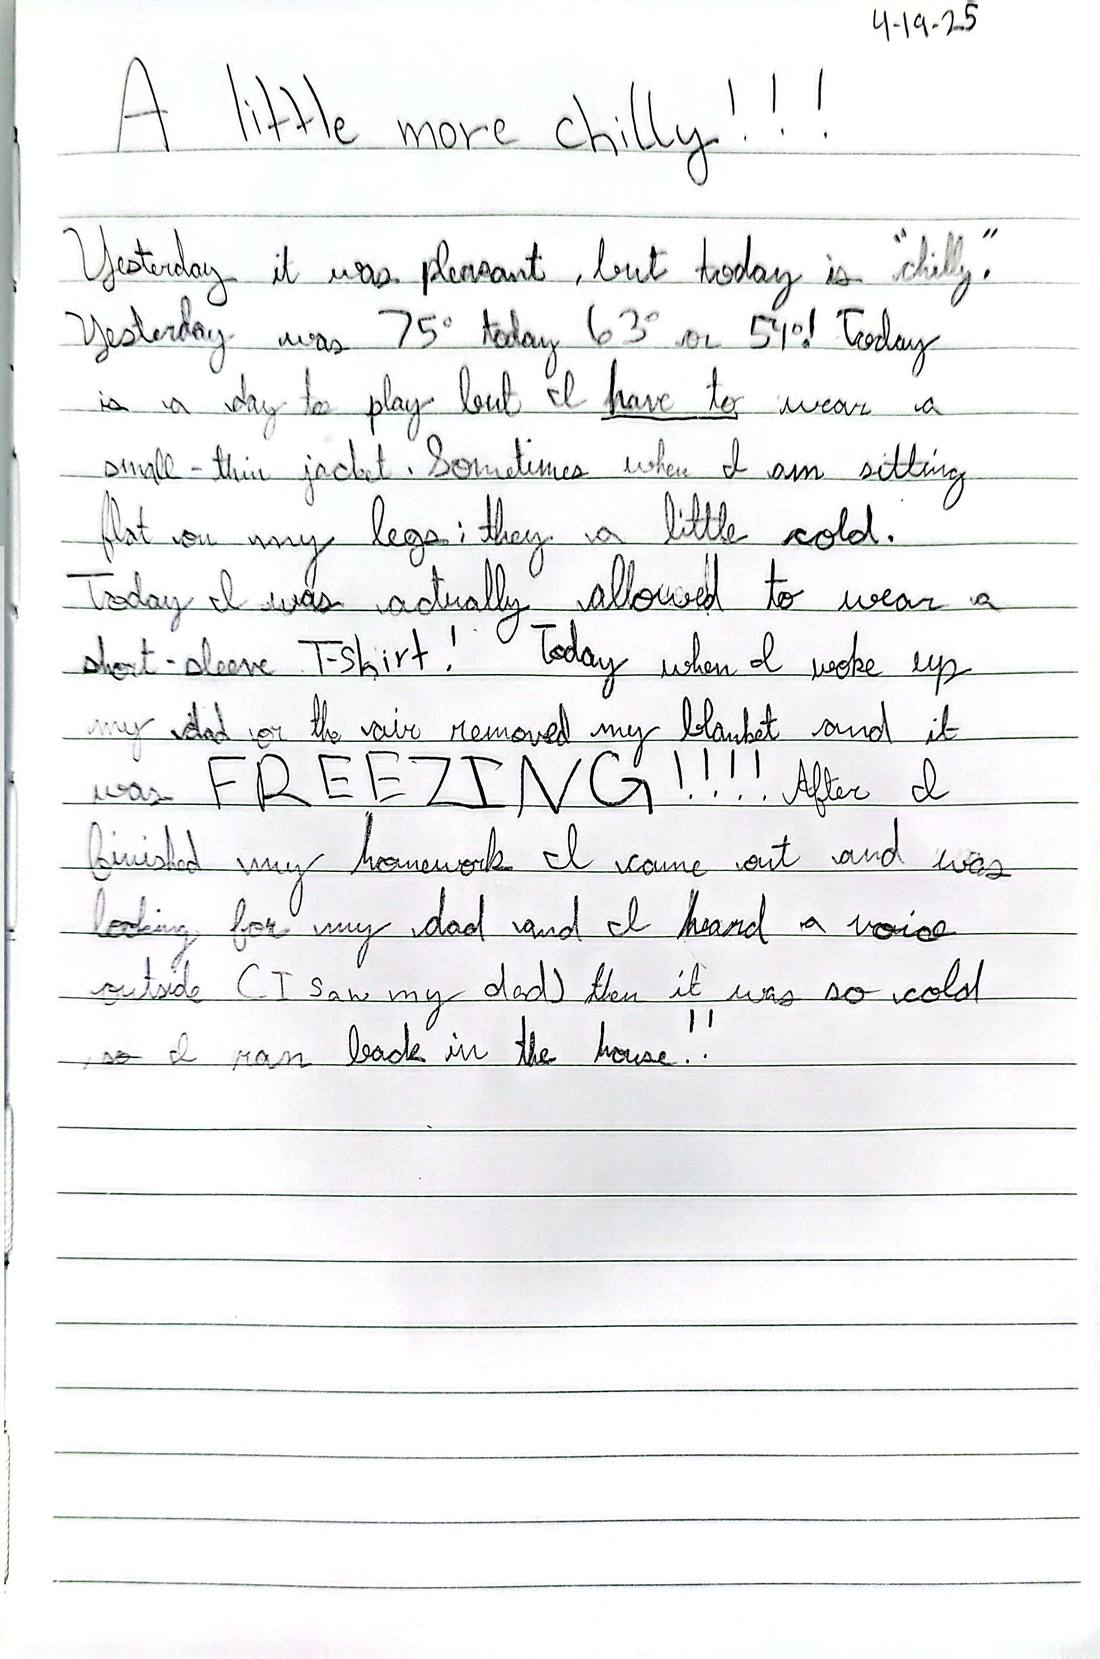
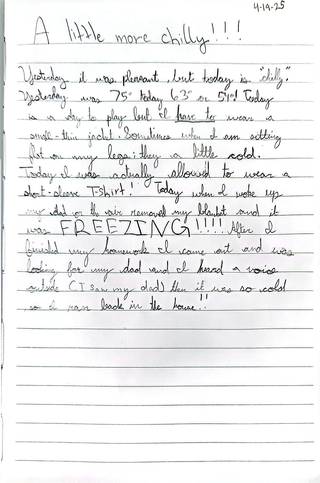 A little more chilly!!!Apr 19, 2025
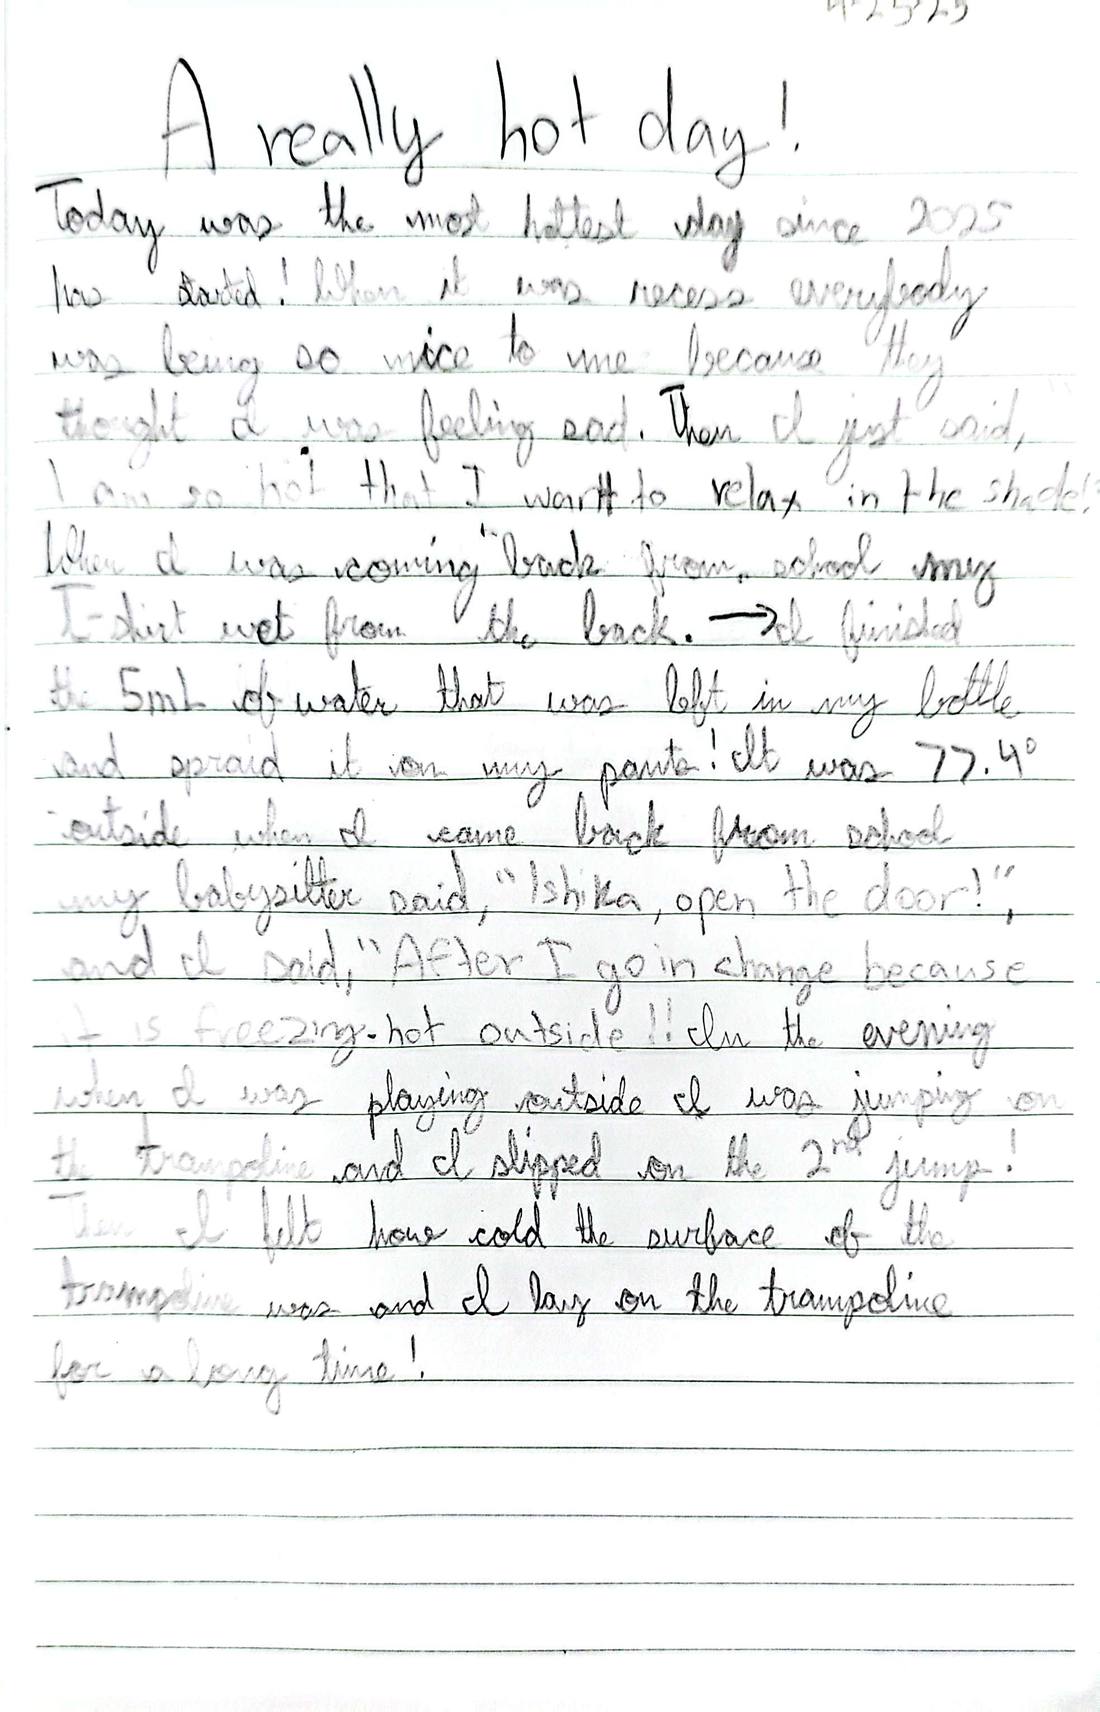
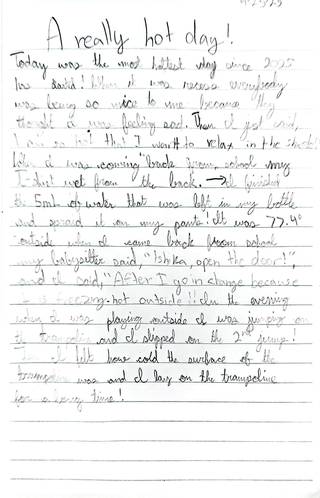 A really hot day!Apr 23, 2025
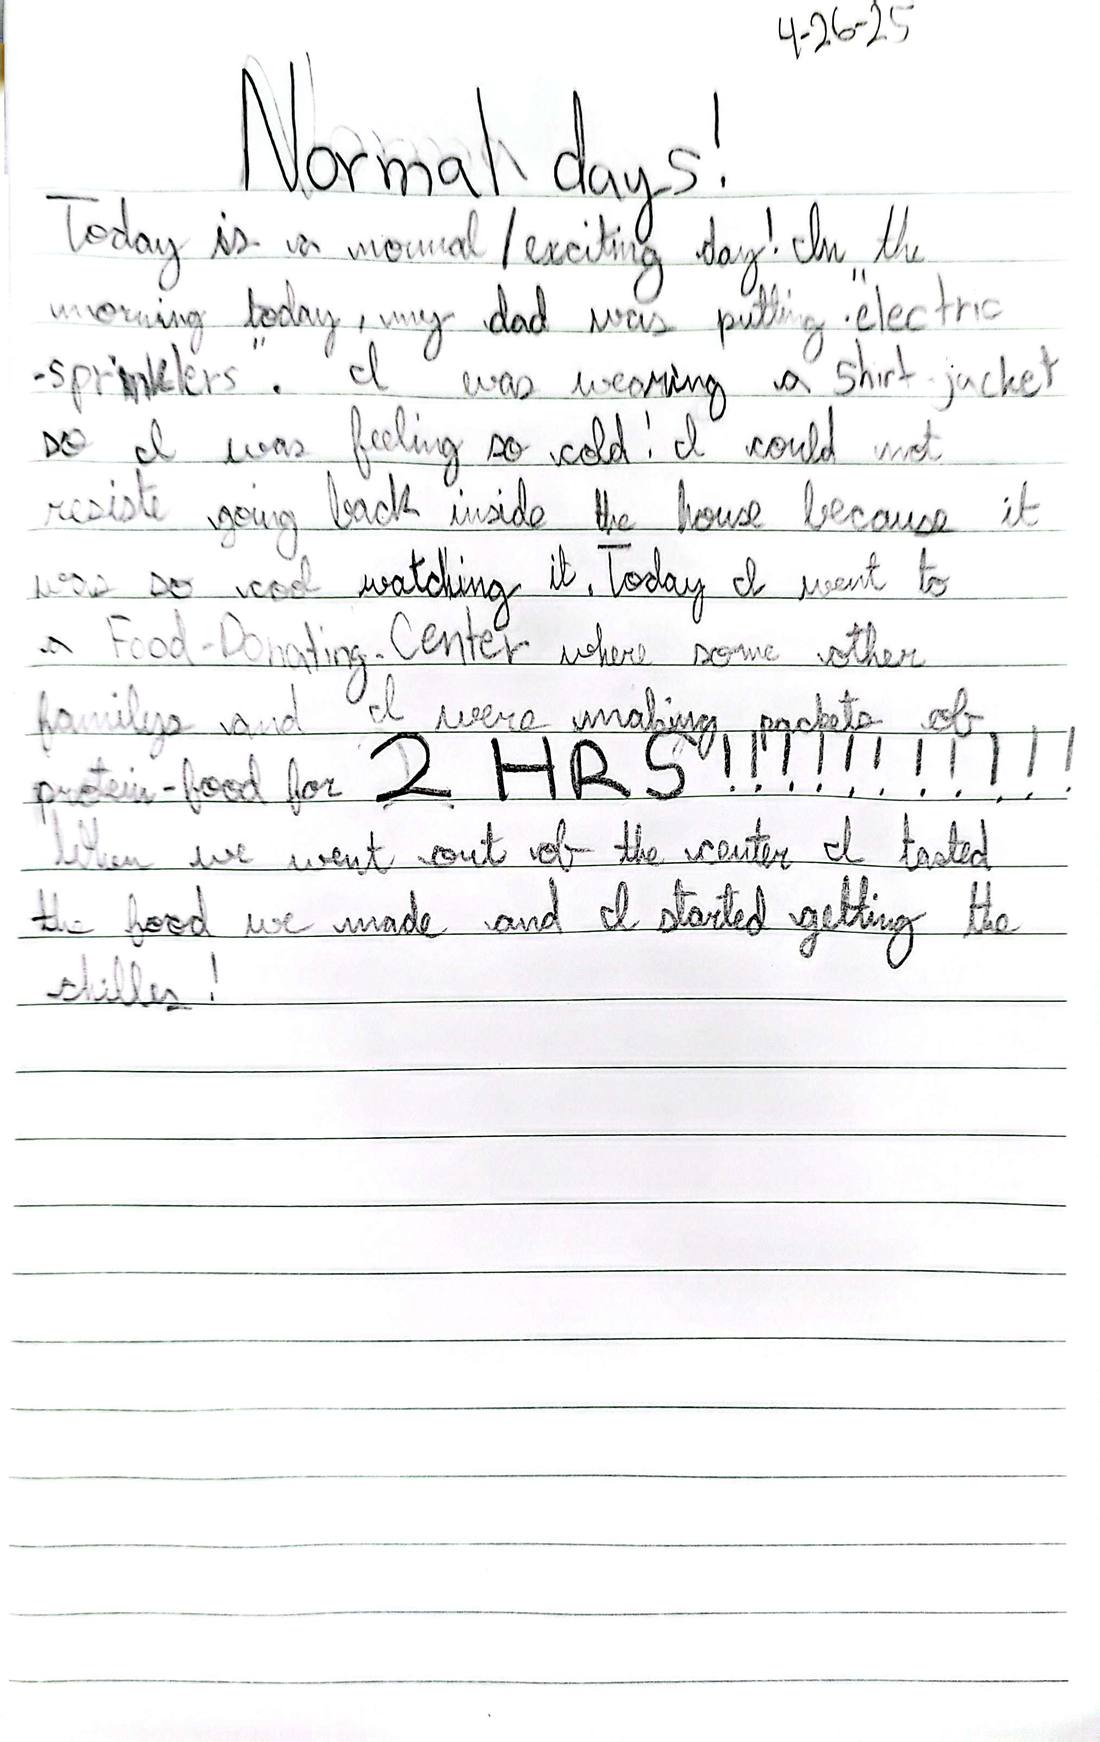
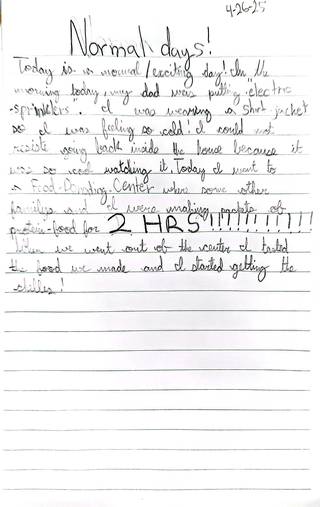 Normal days!Apr 26, 2025
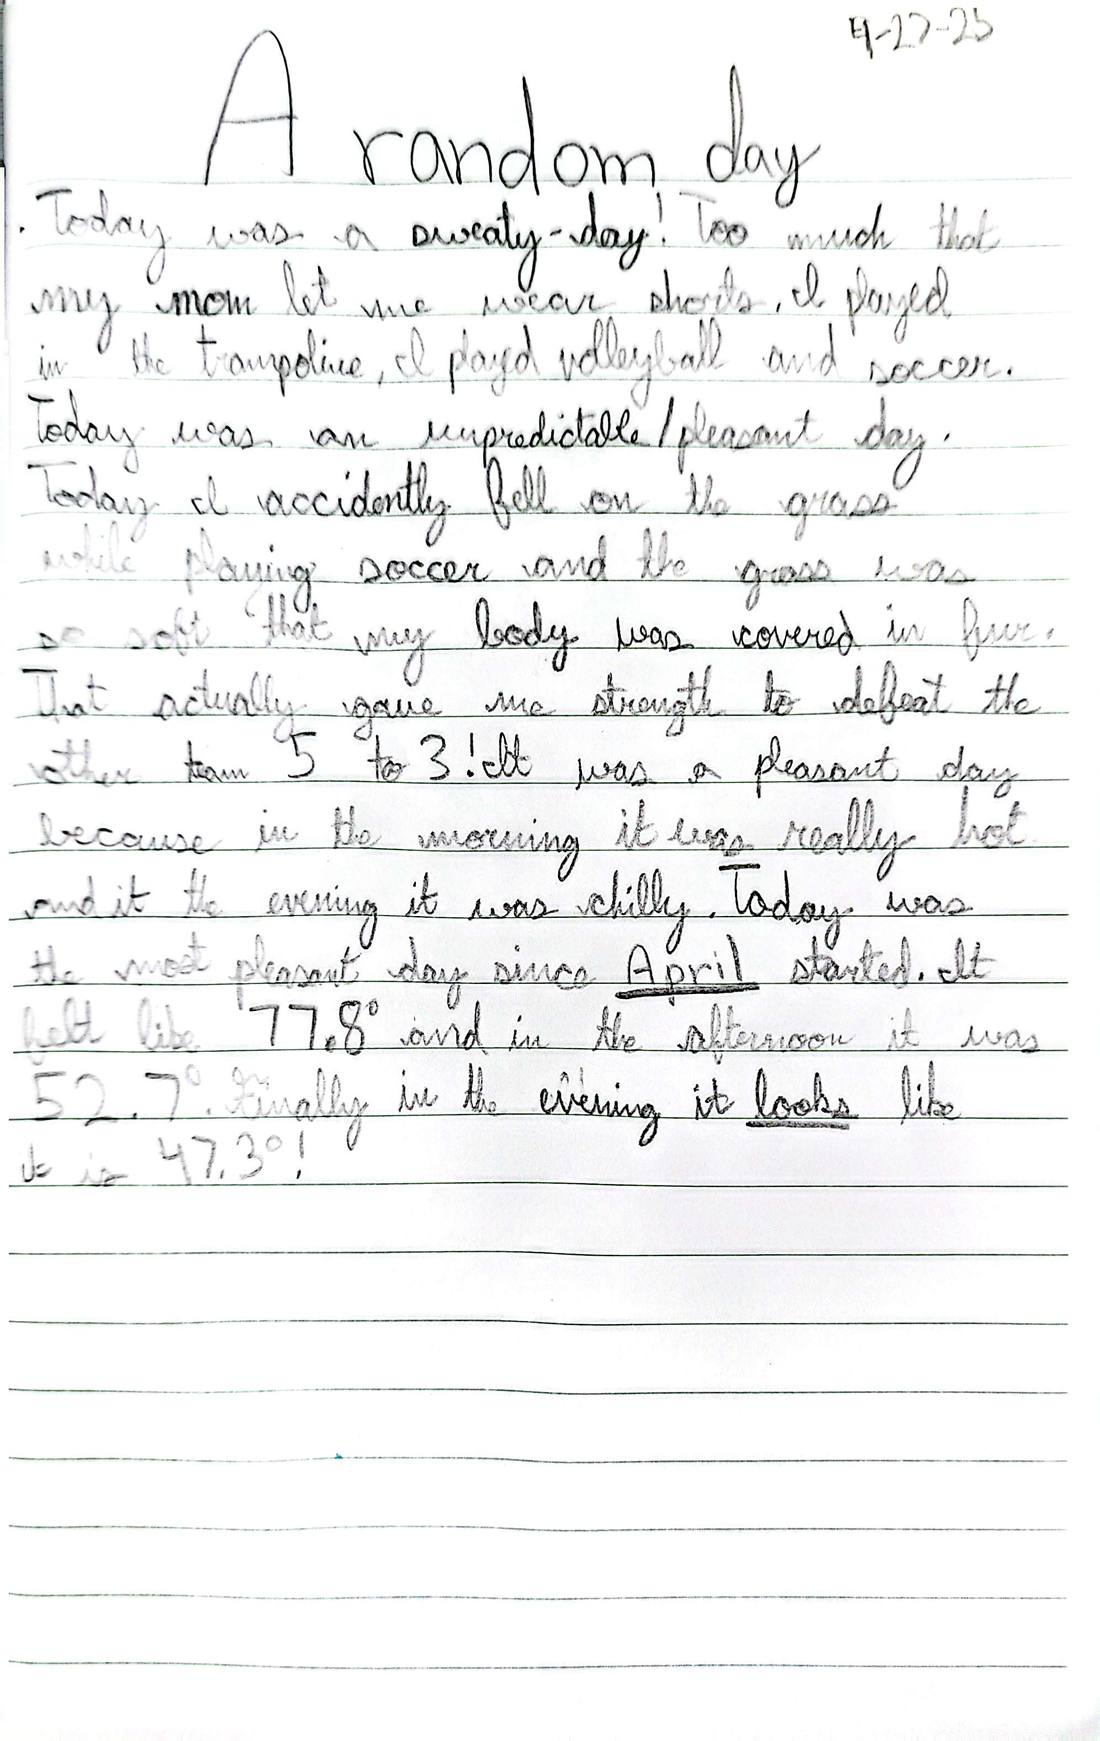
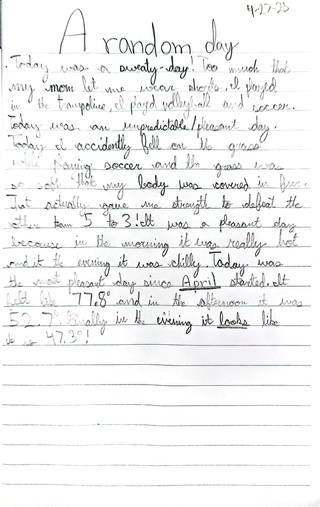 A random dayApr 27, 2025
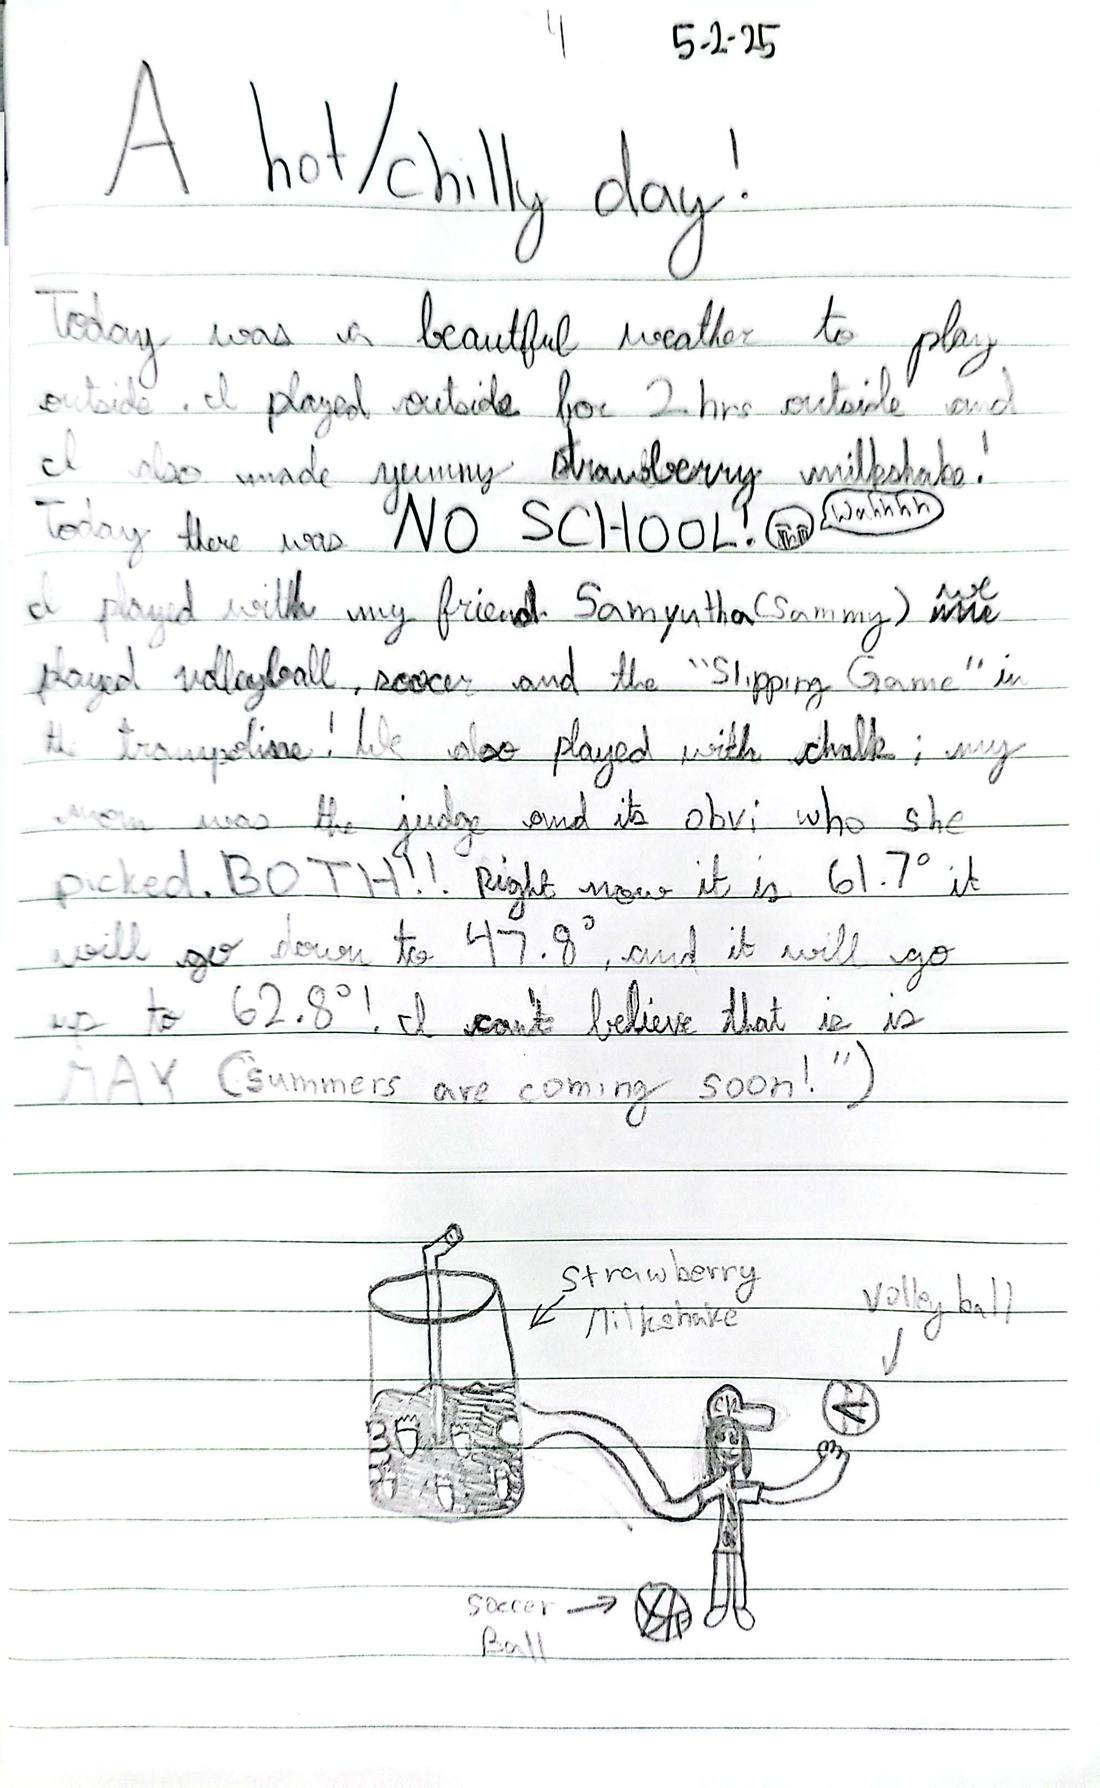
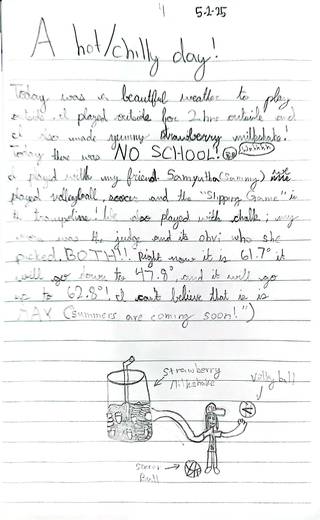 A hot/chilly day!May 1, 2025
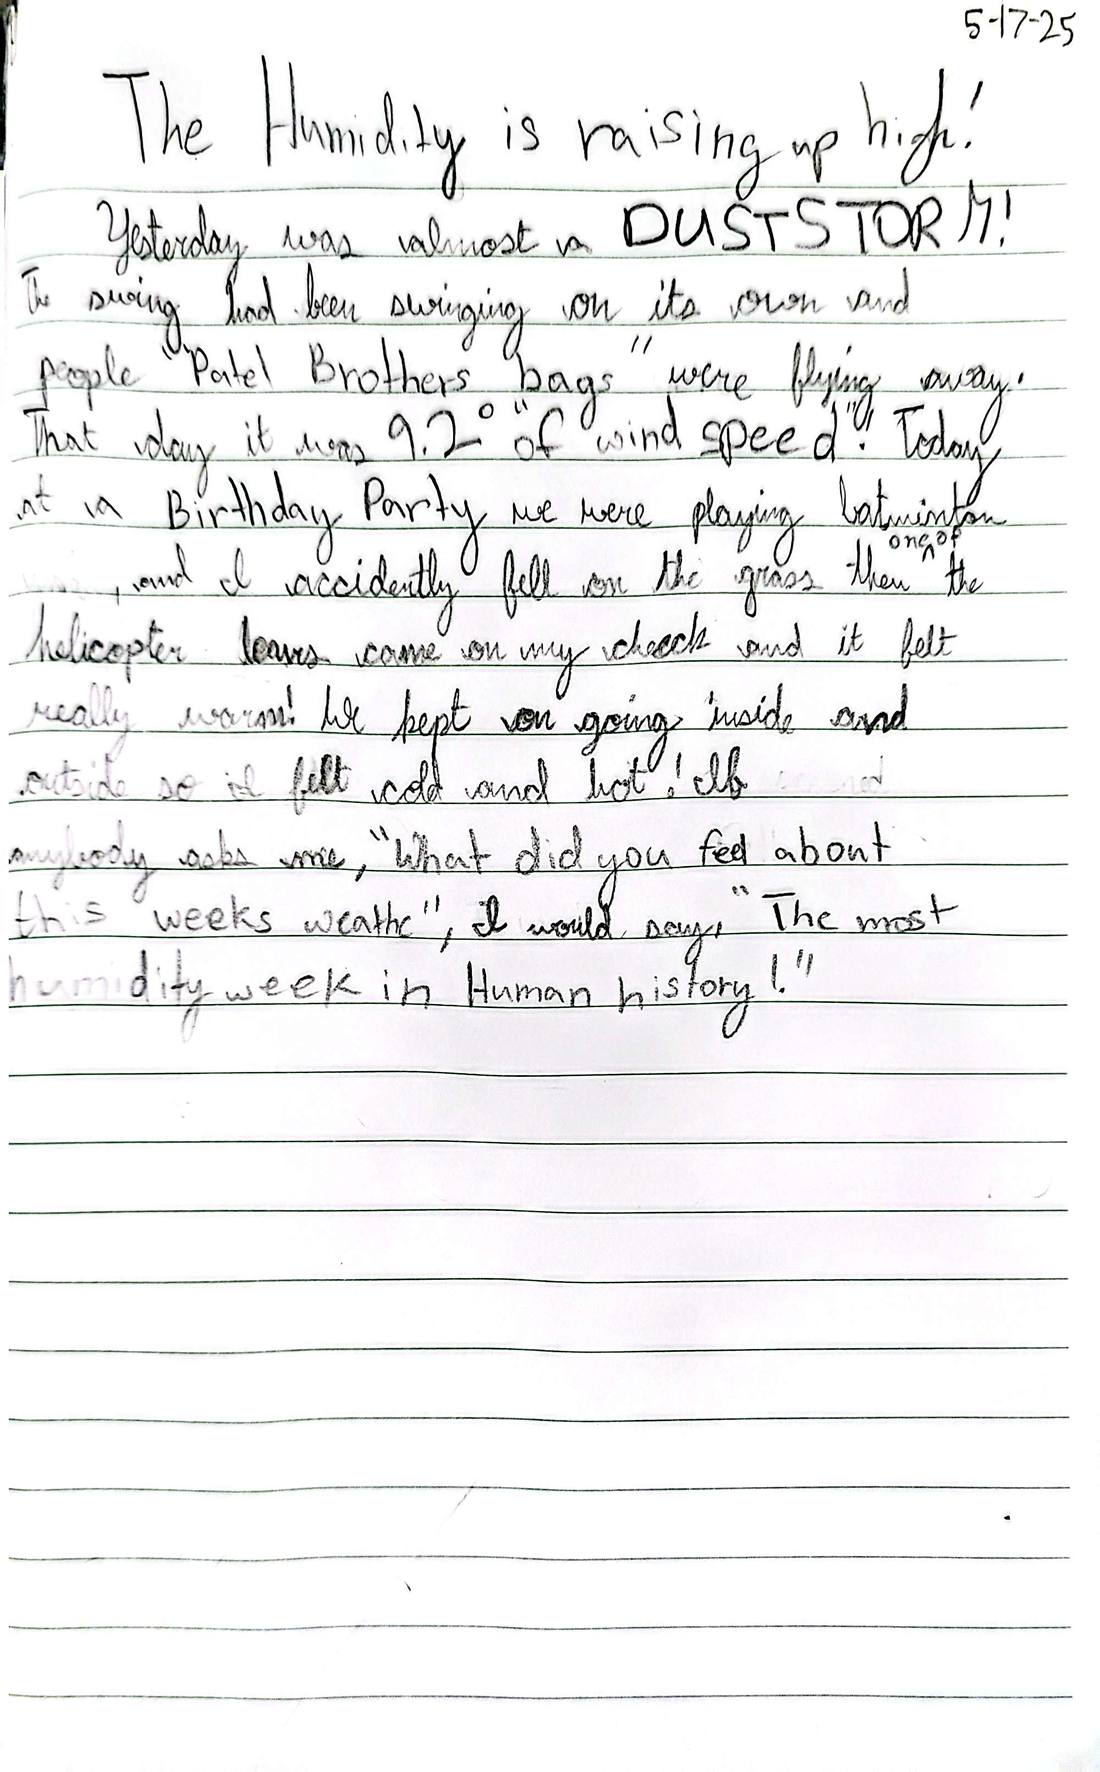
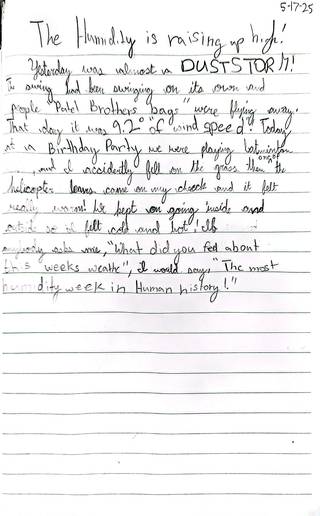 The humidity is rising up high!May 17, 2025
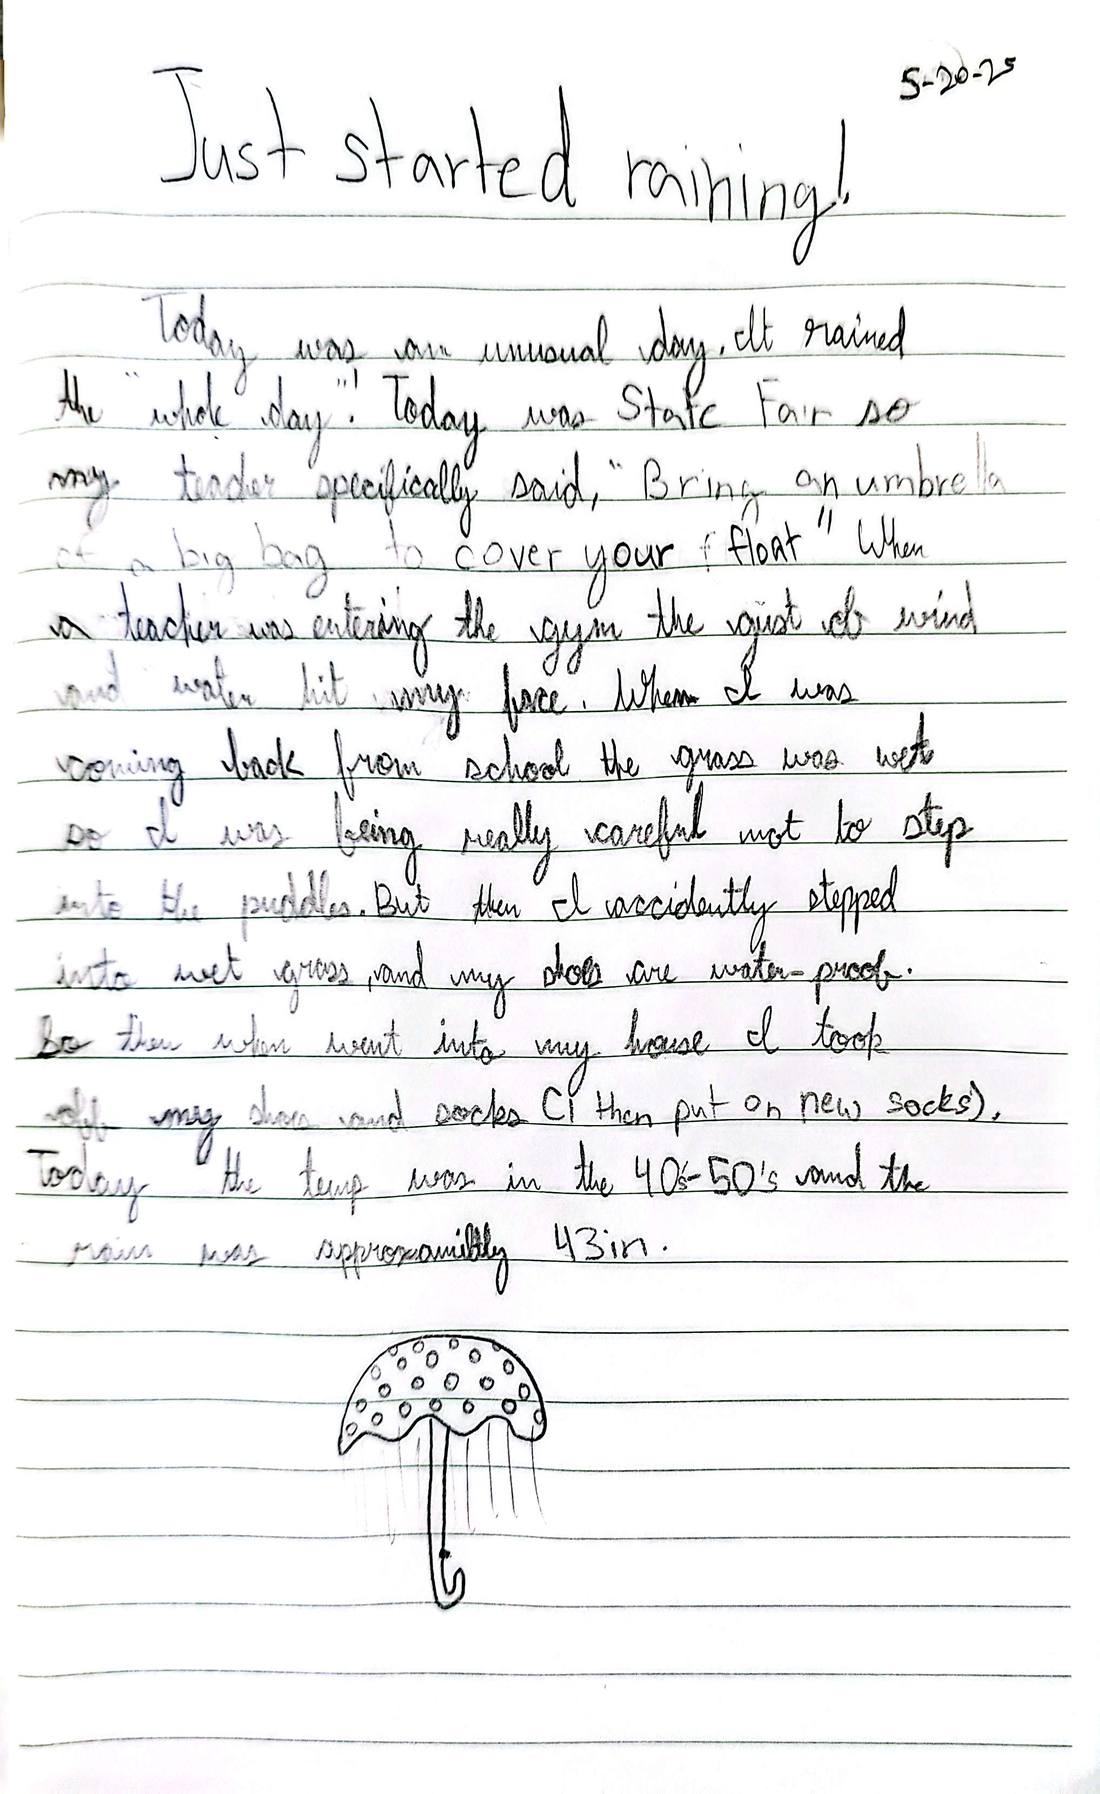
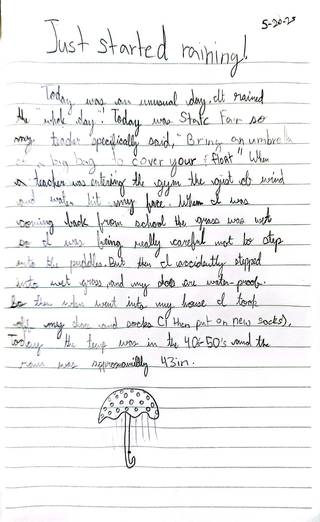 Just started raining!May 20, 2025
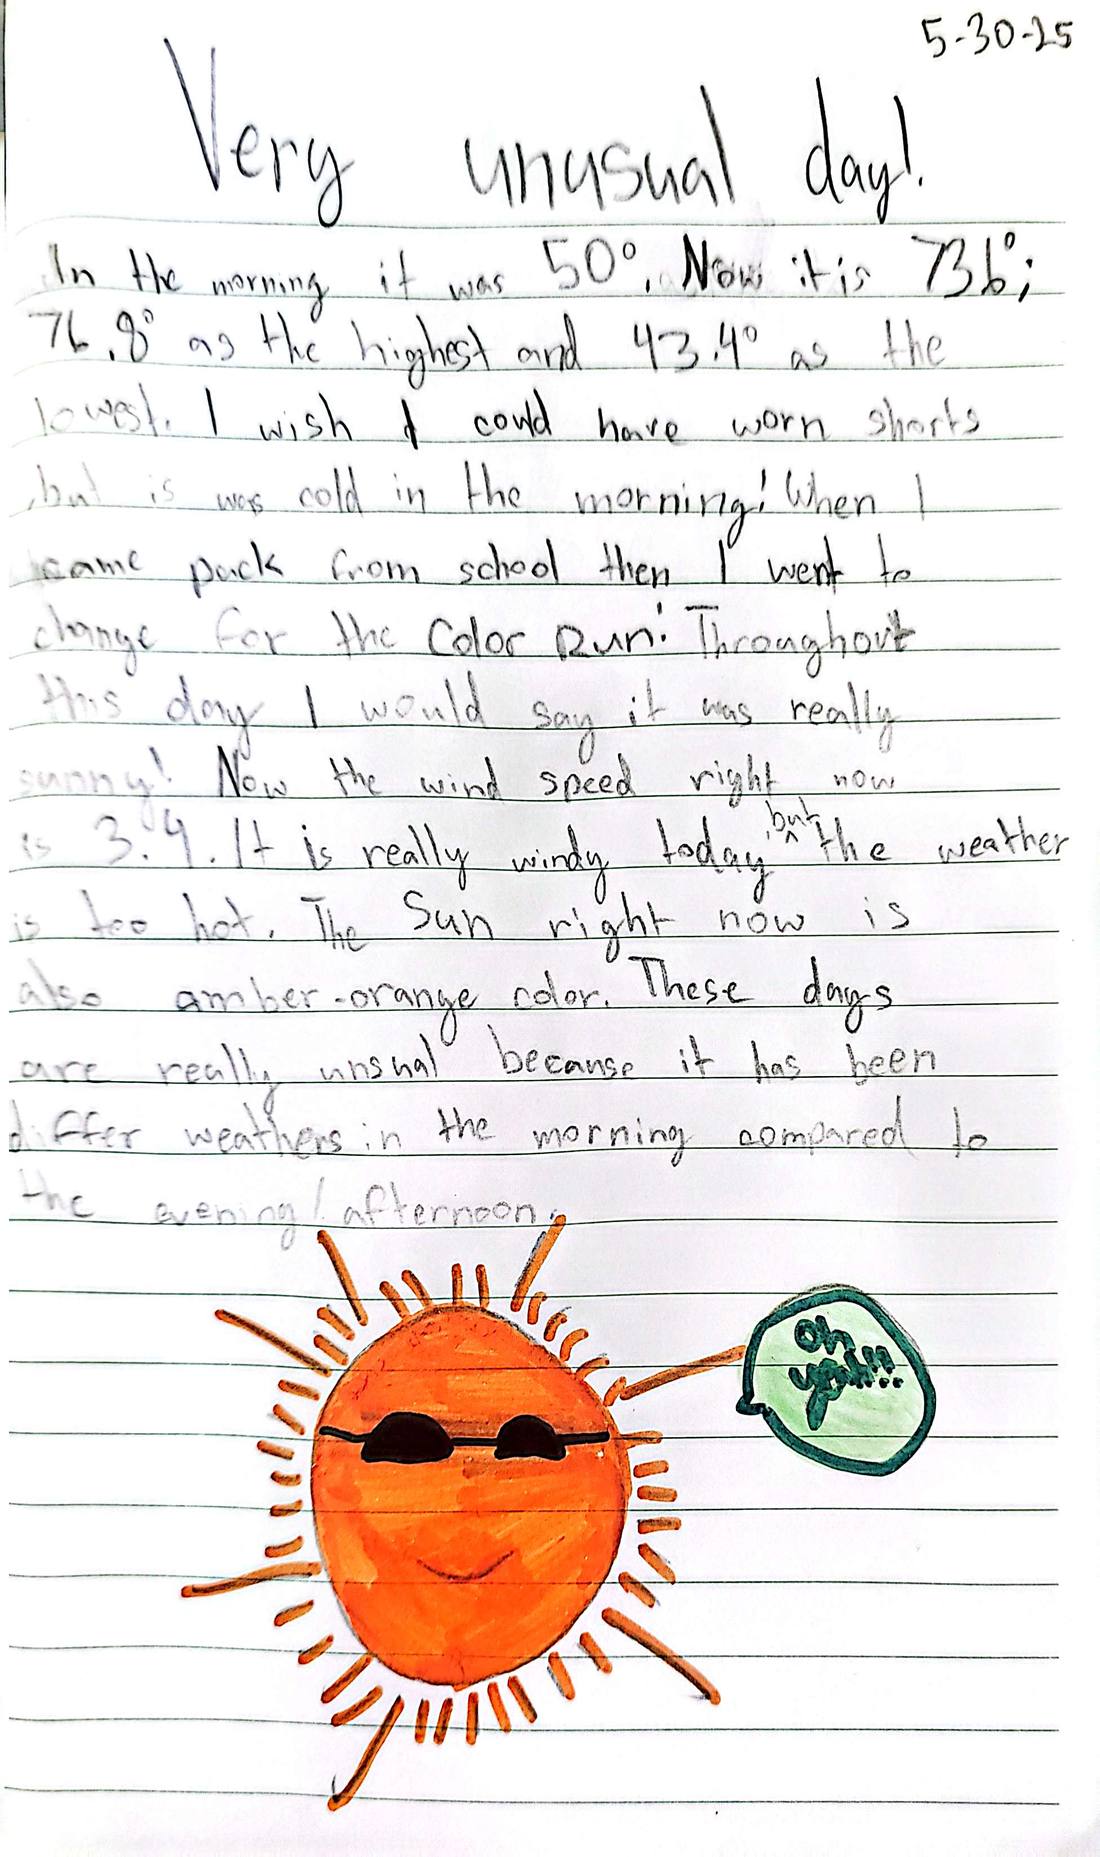
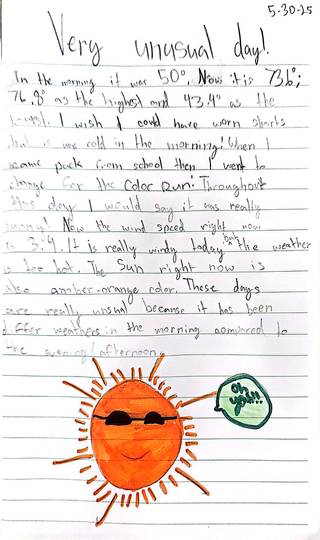 Very unusual day!May 30, 2025
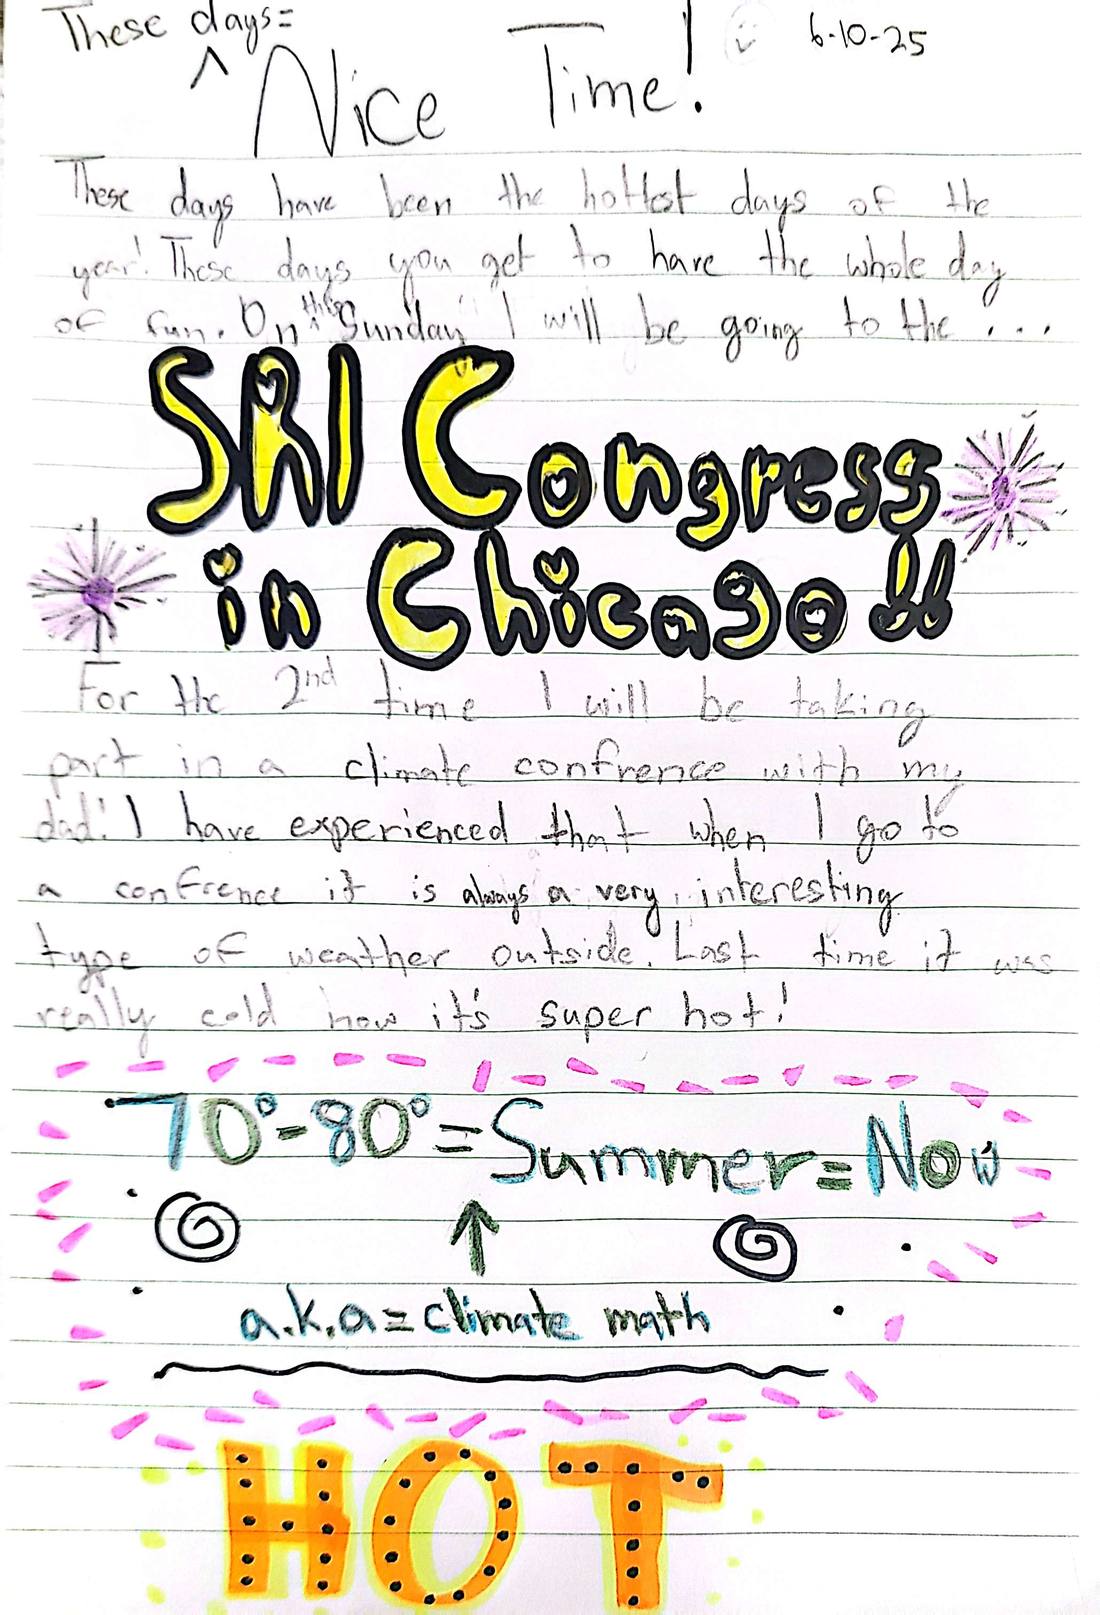
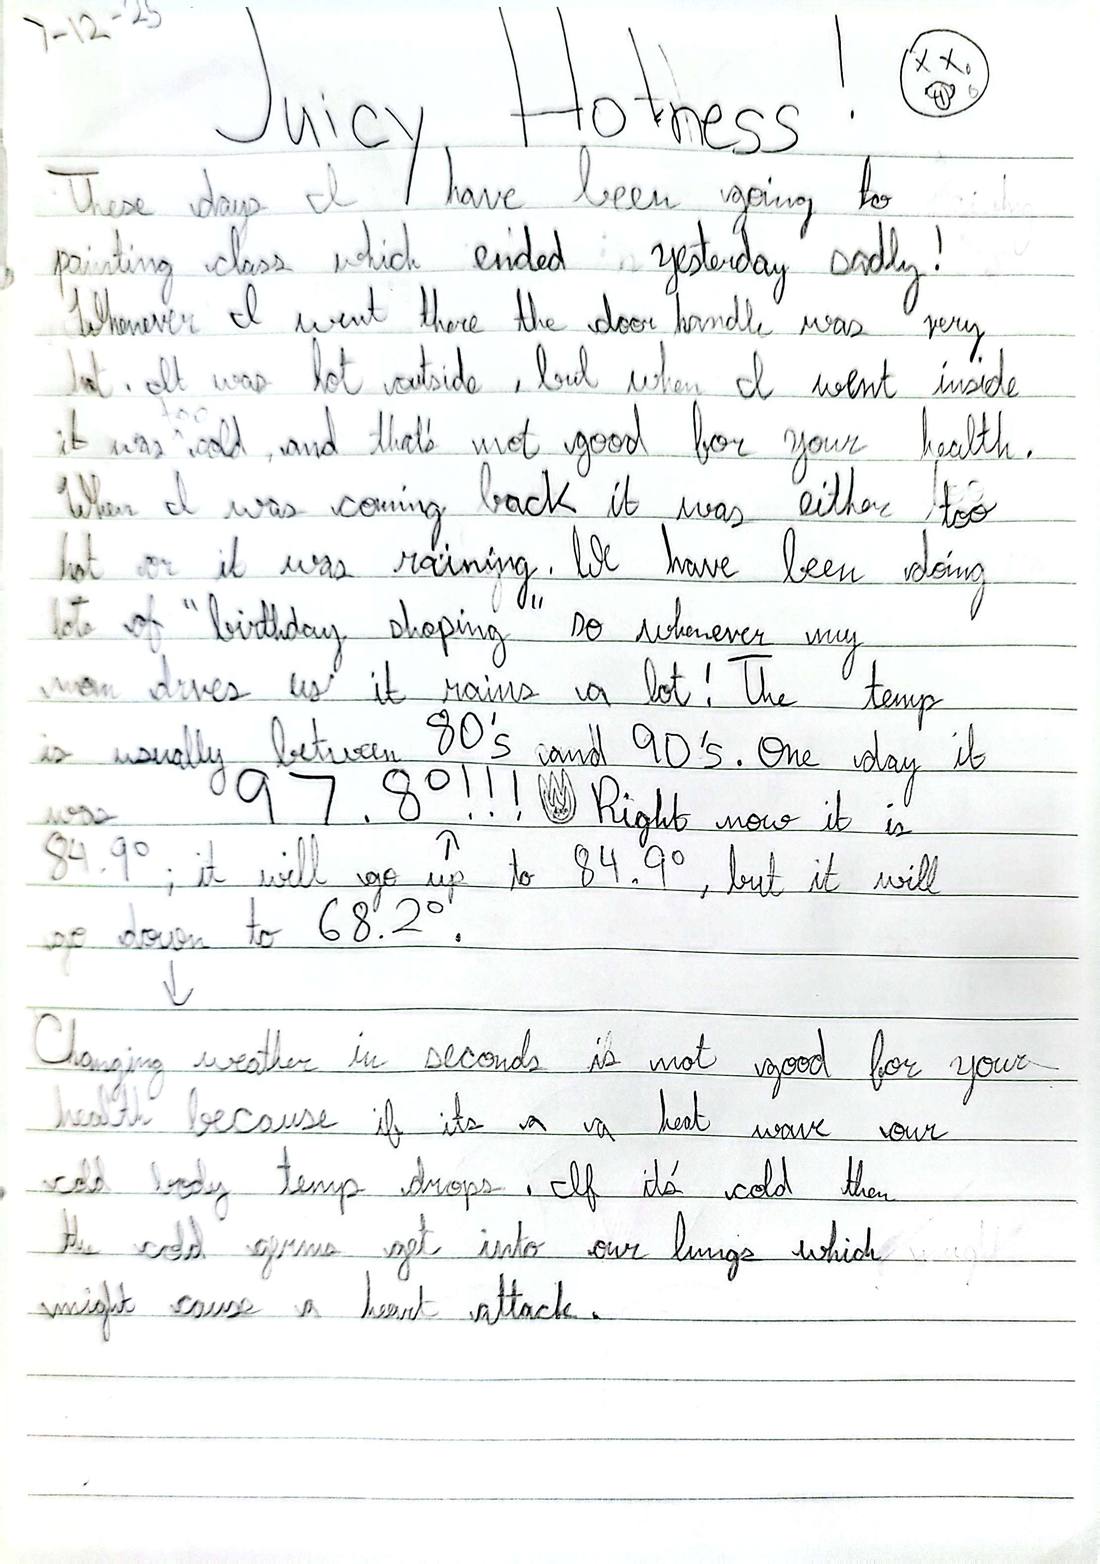
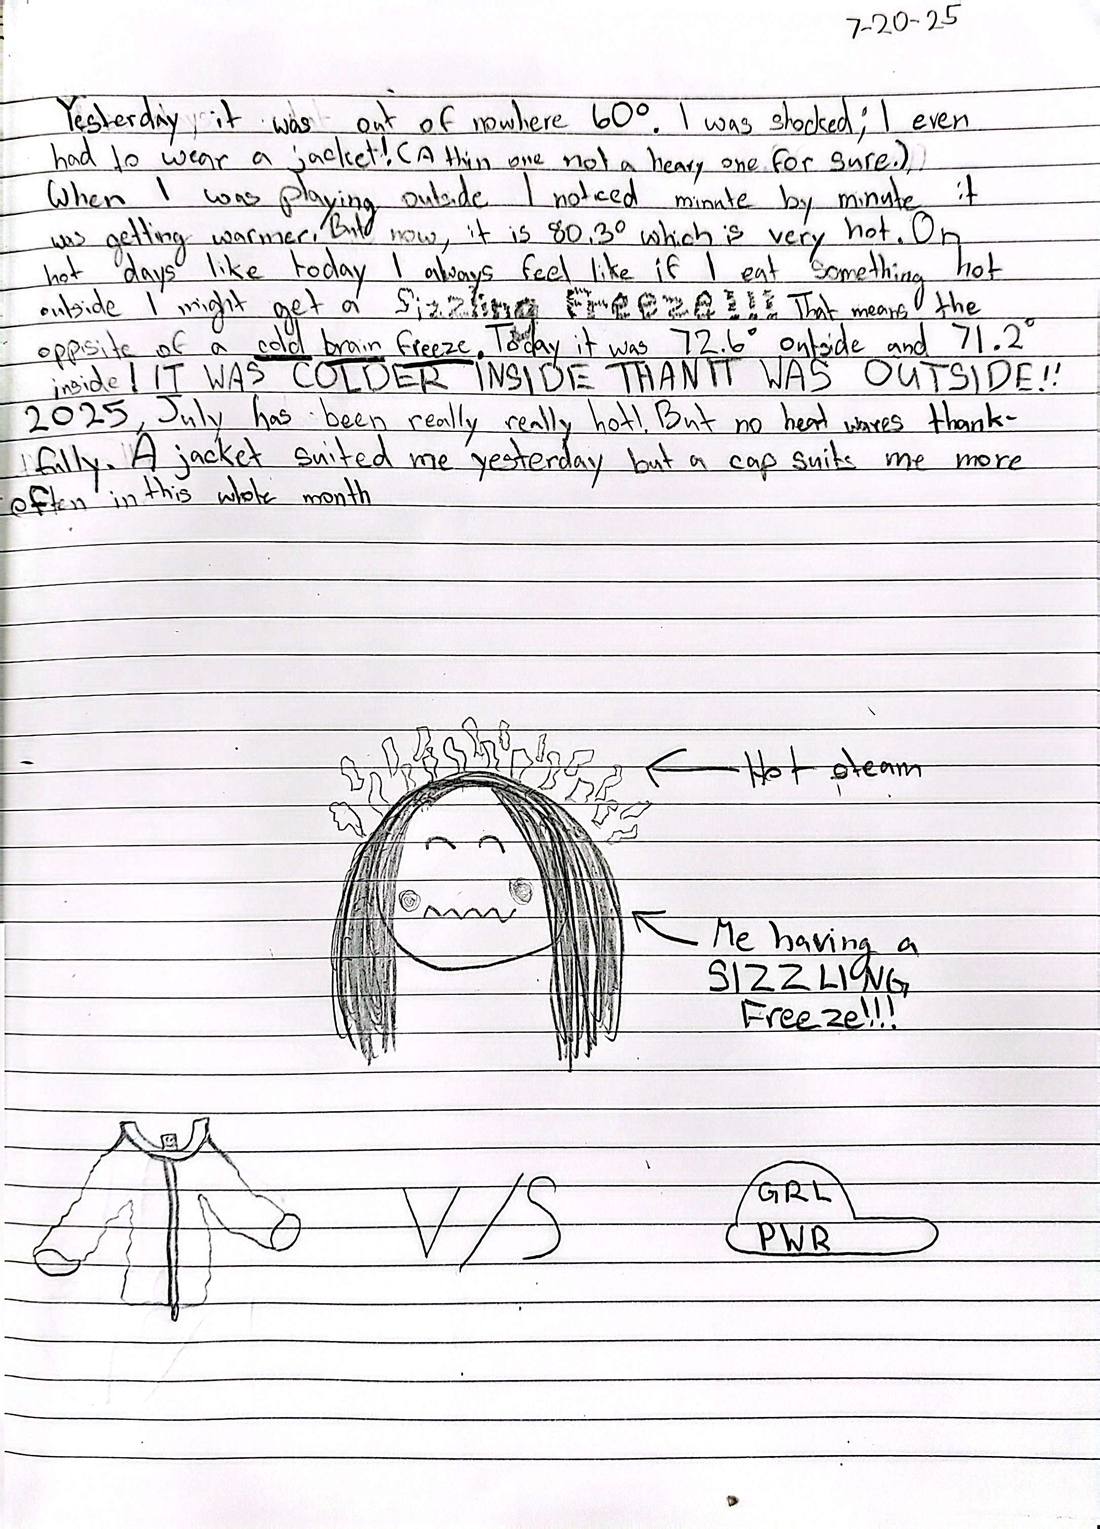
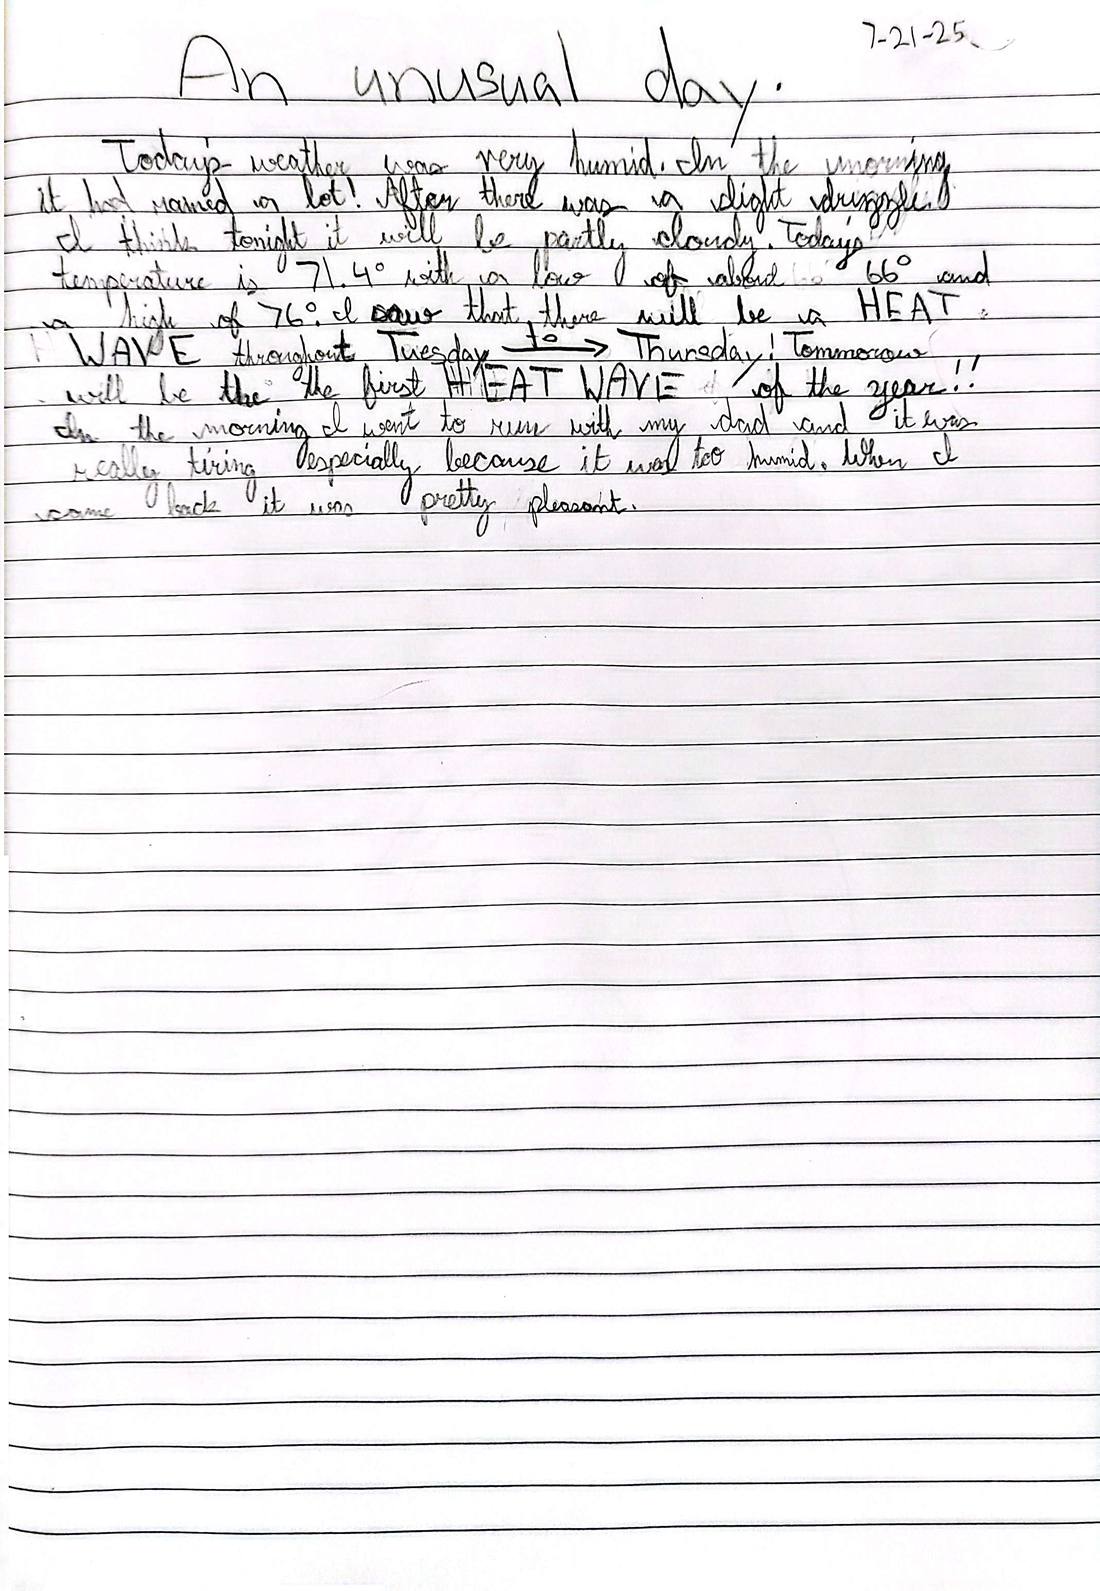
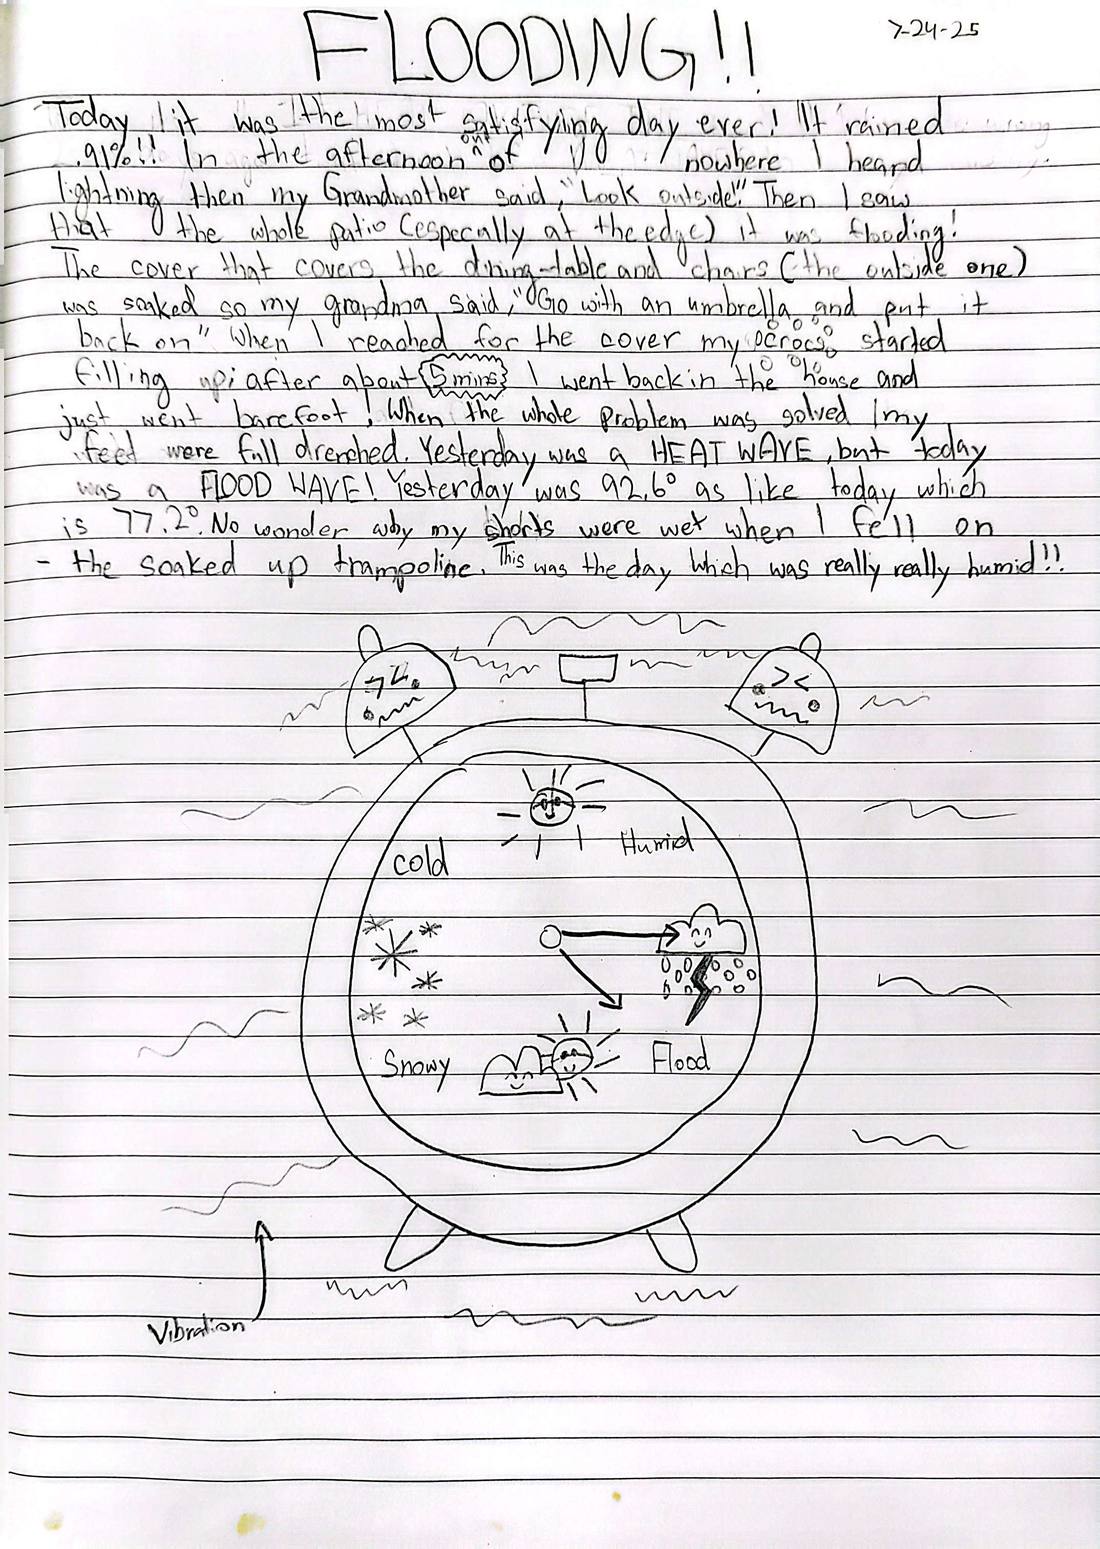
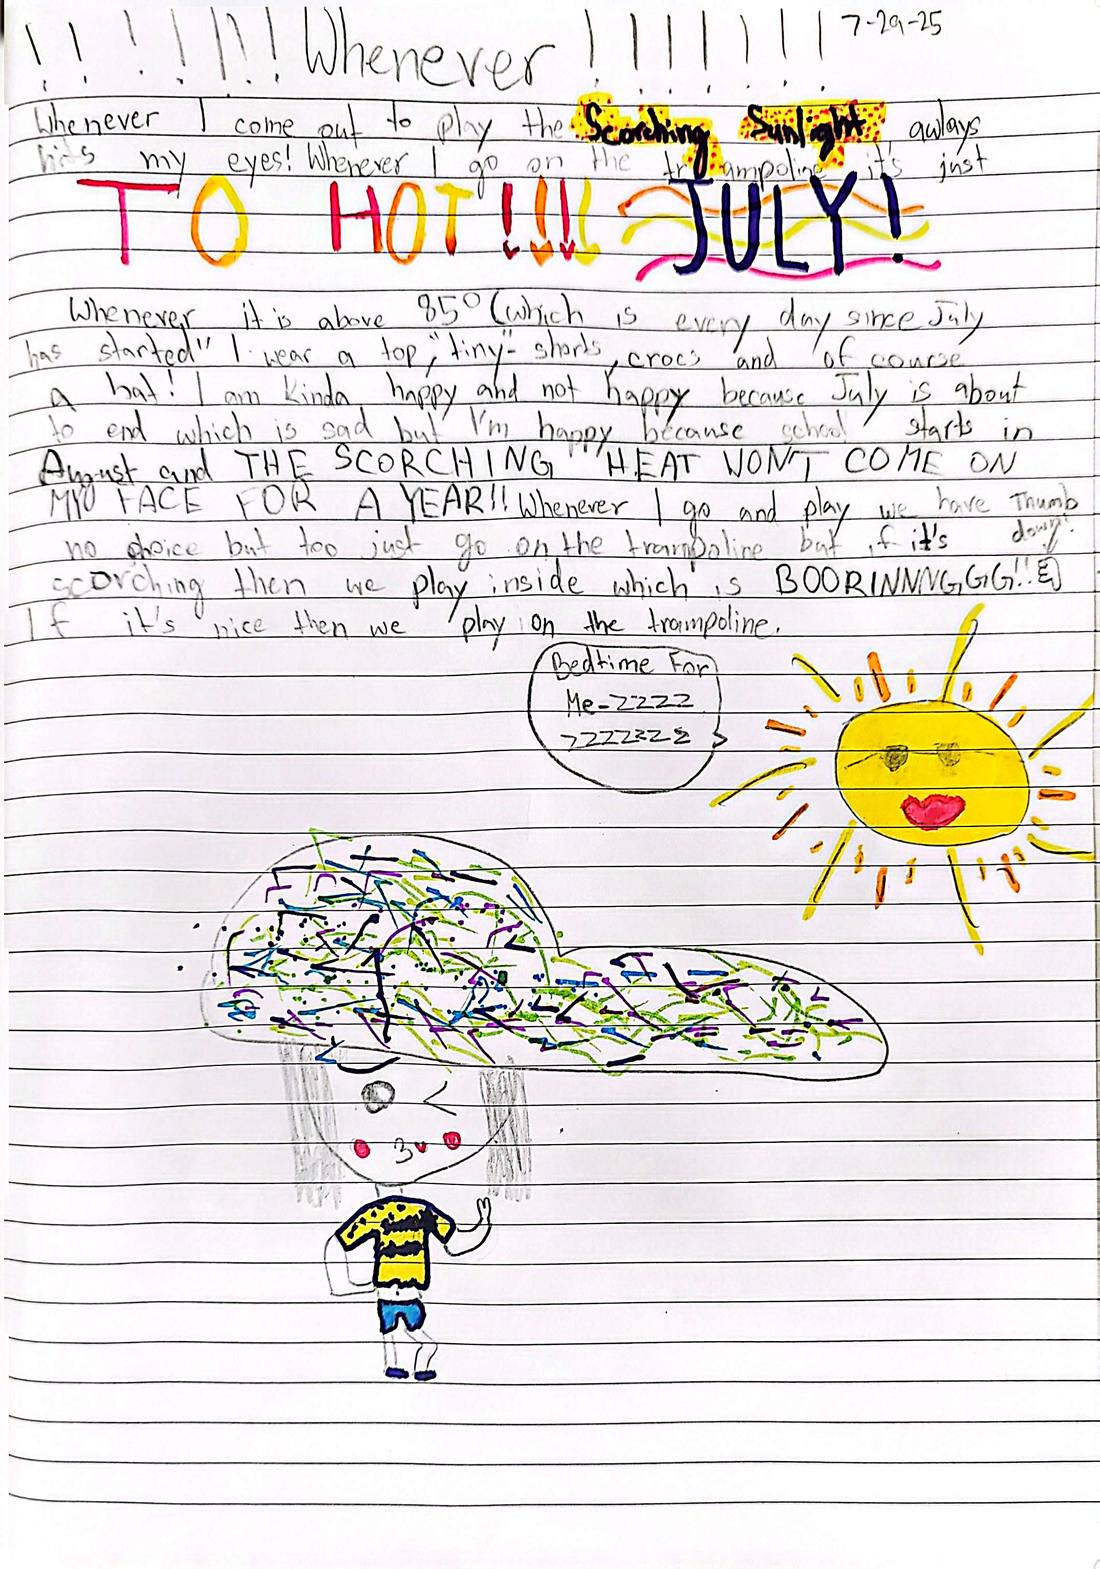
Summer 2025 8 pages
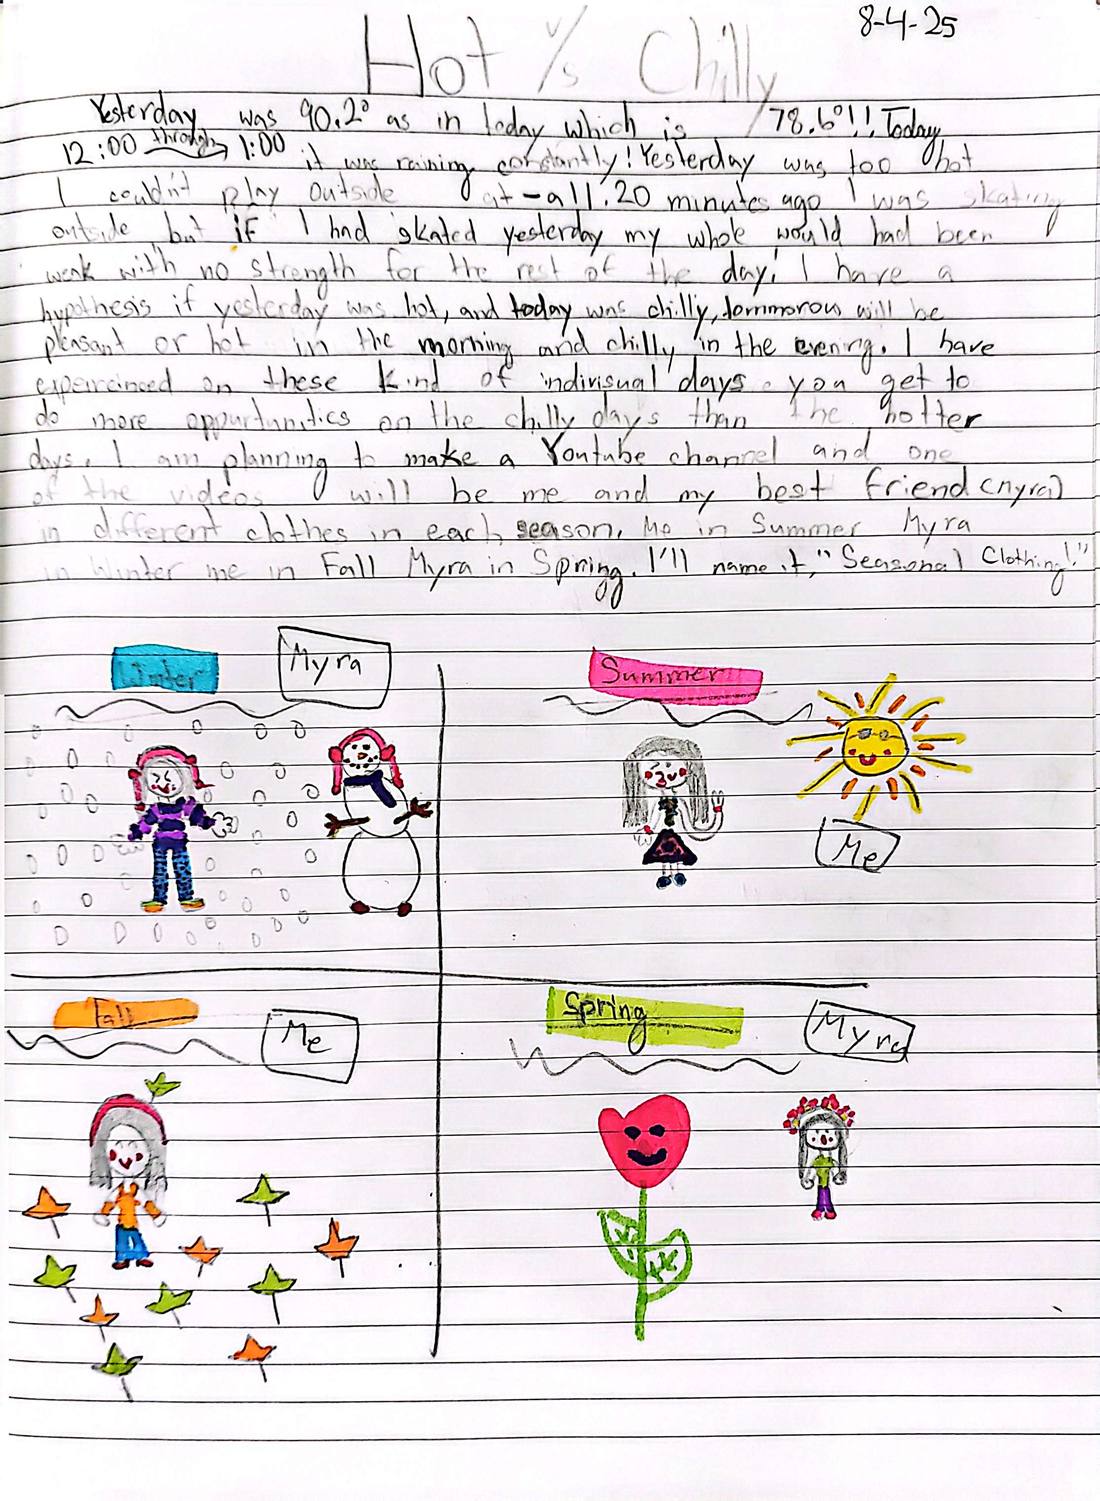
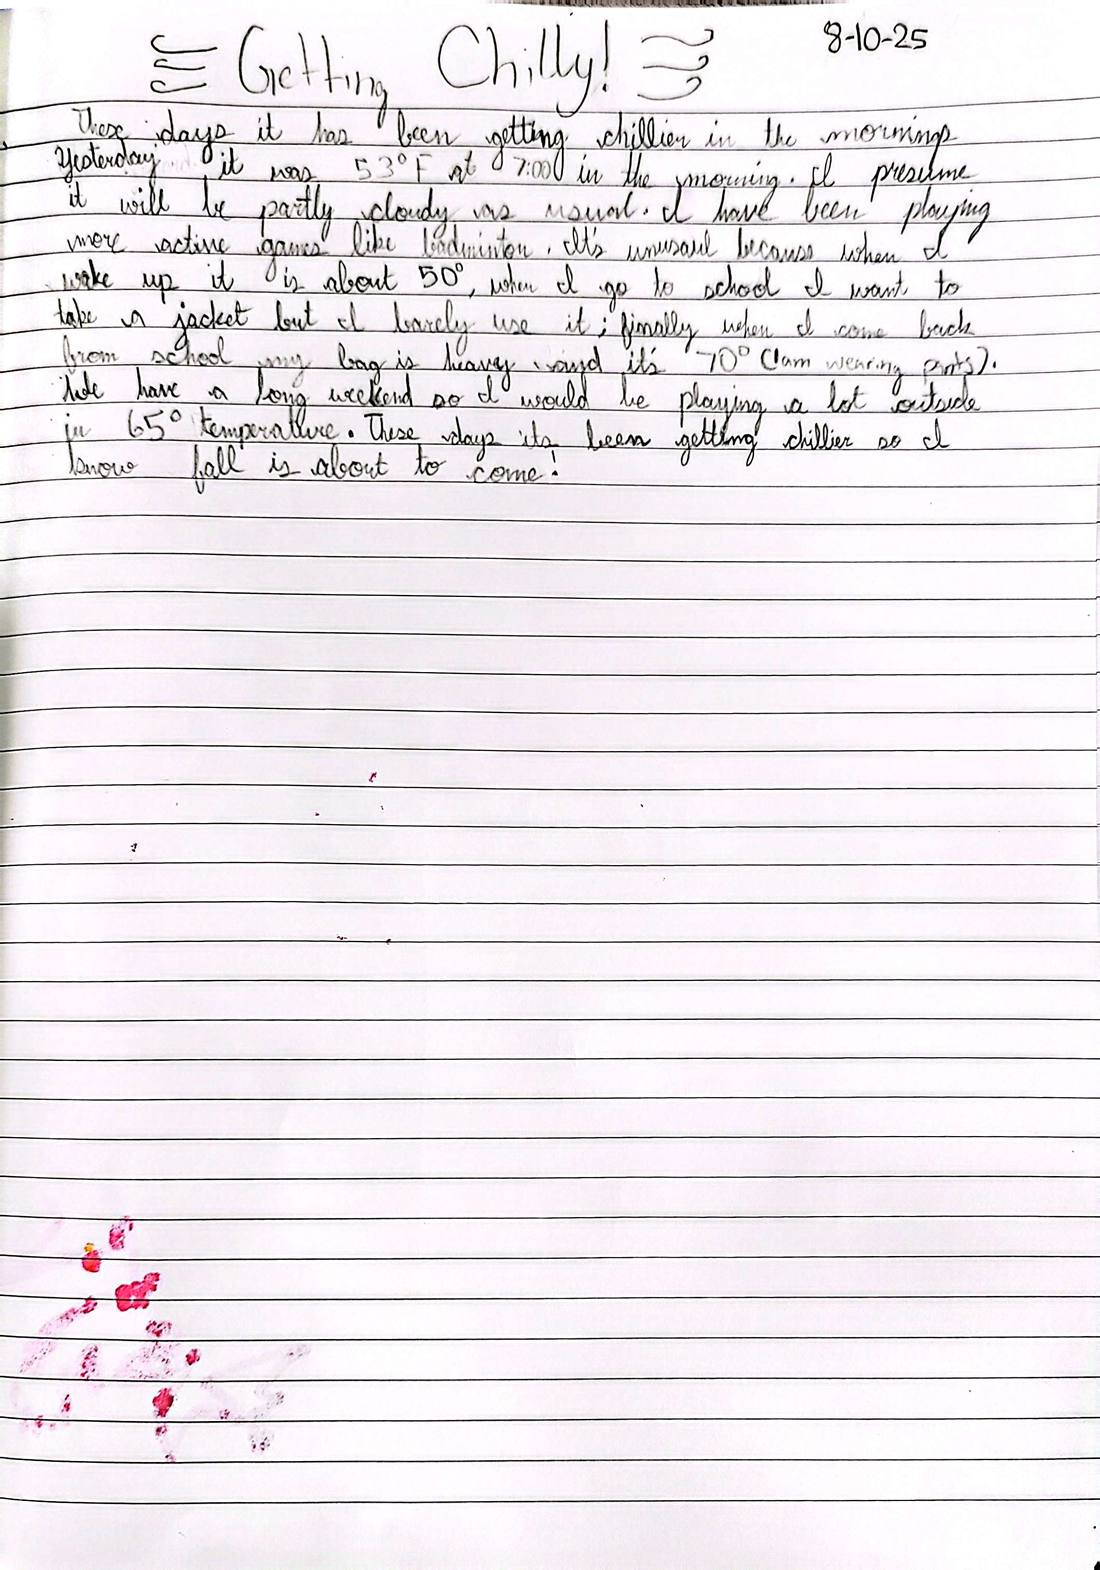
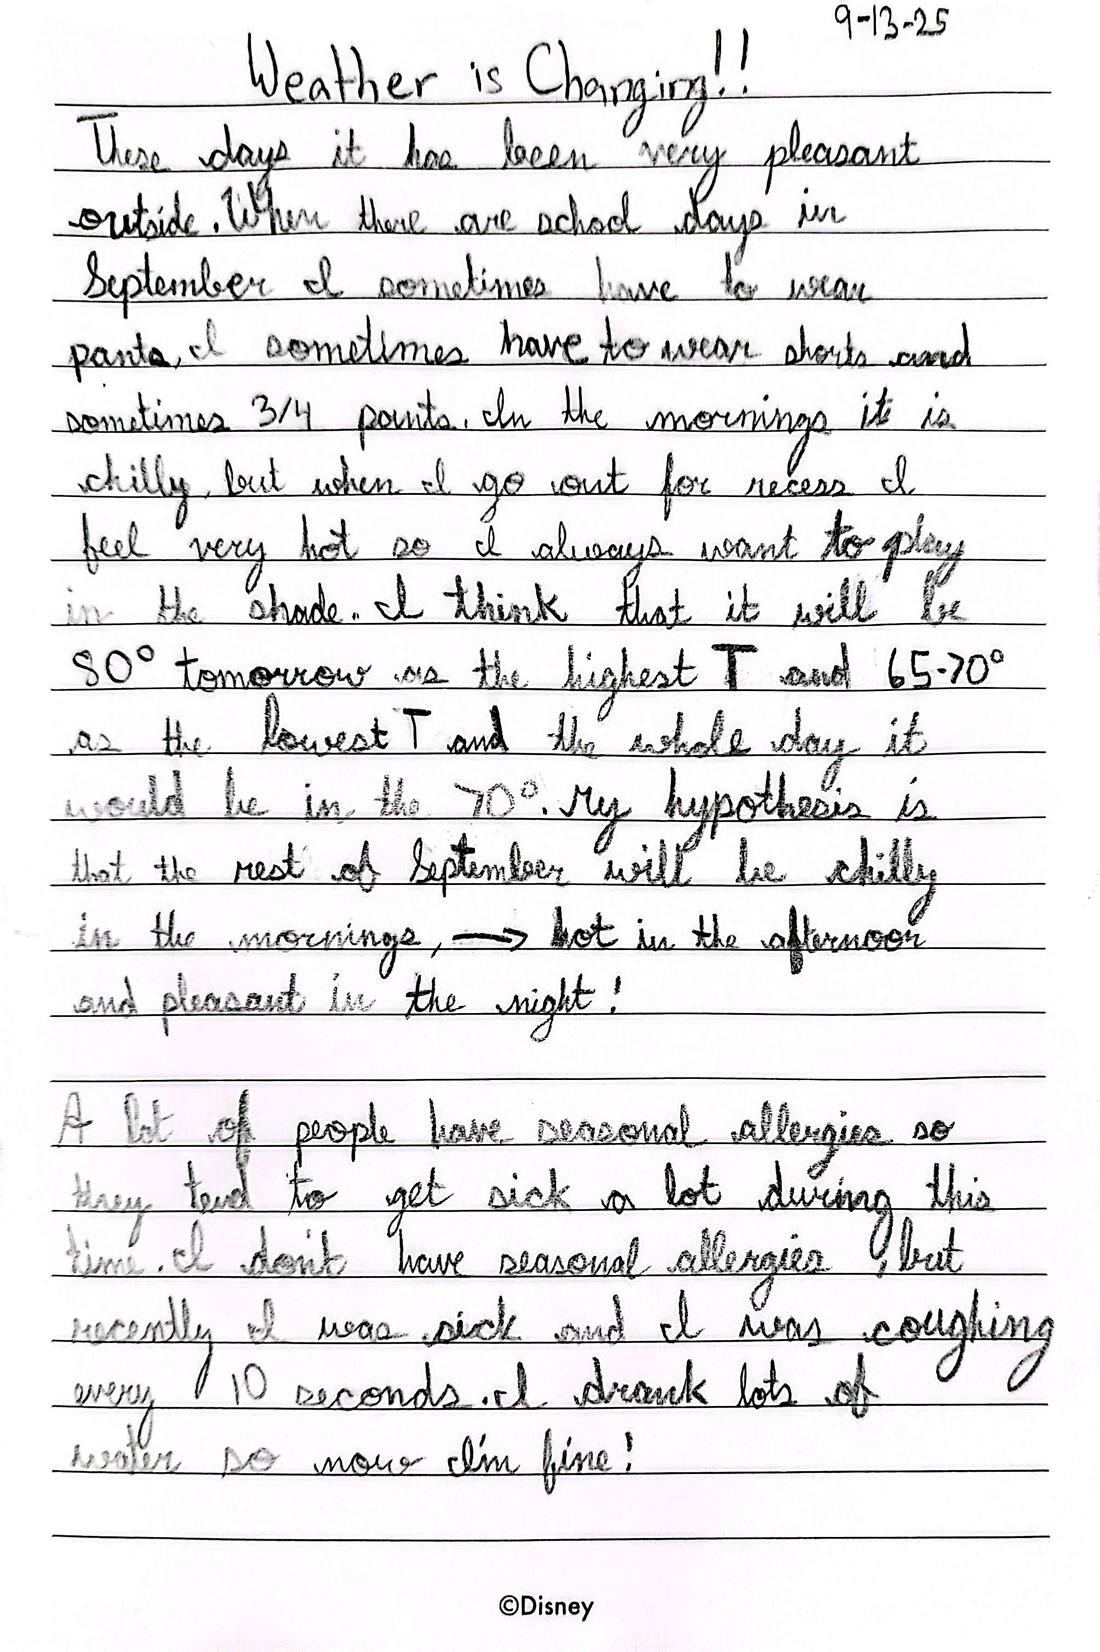
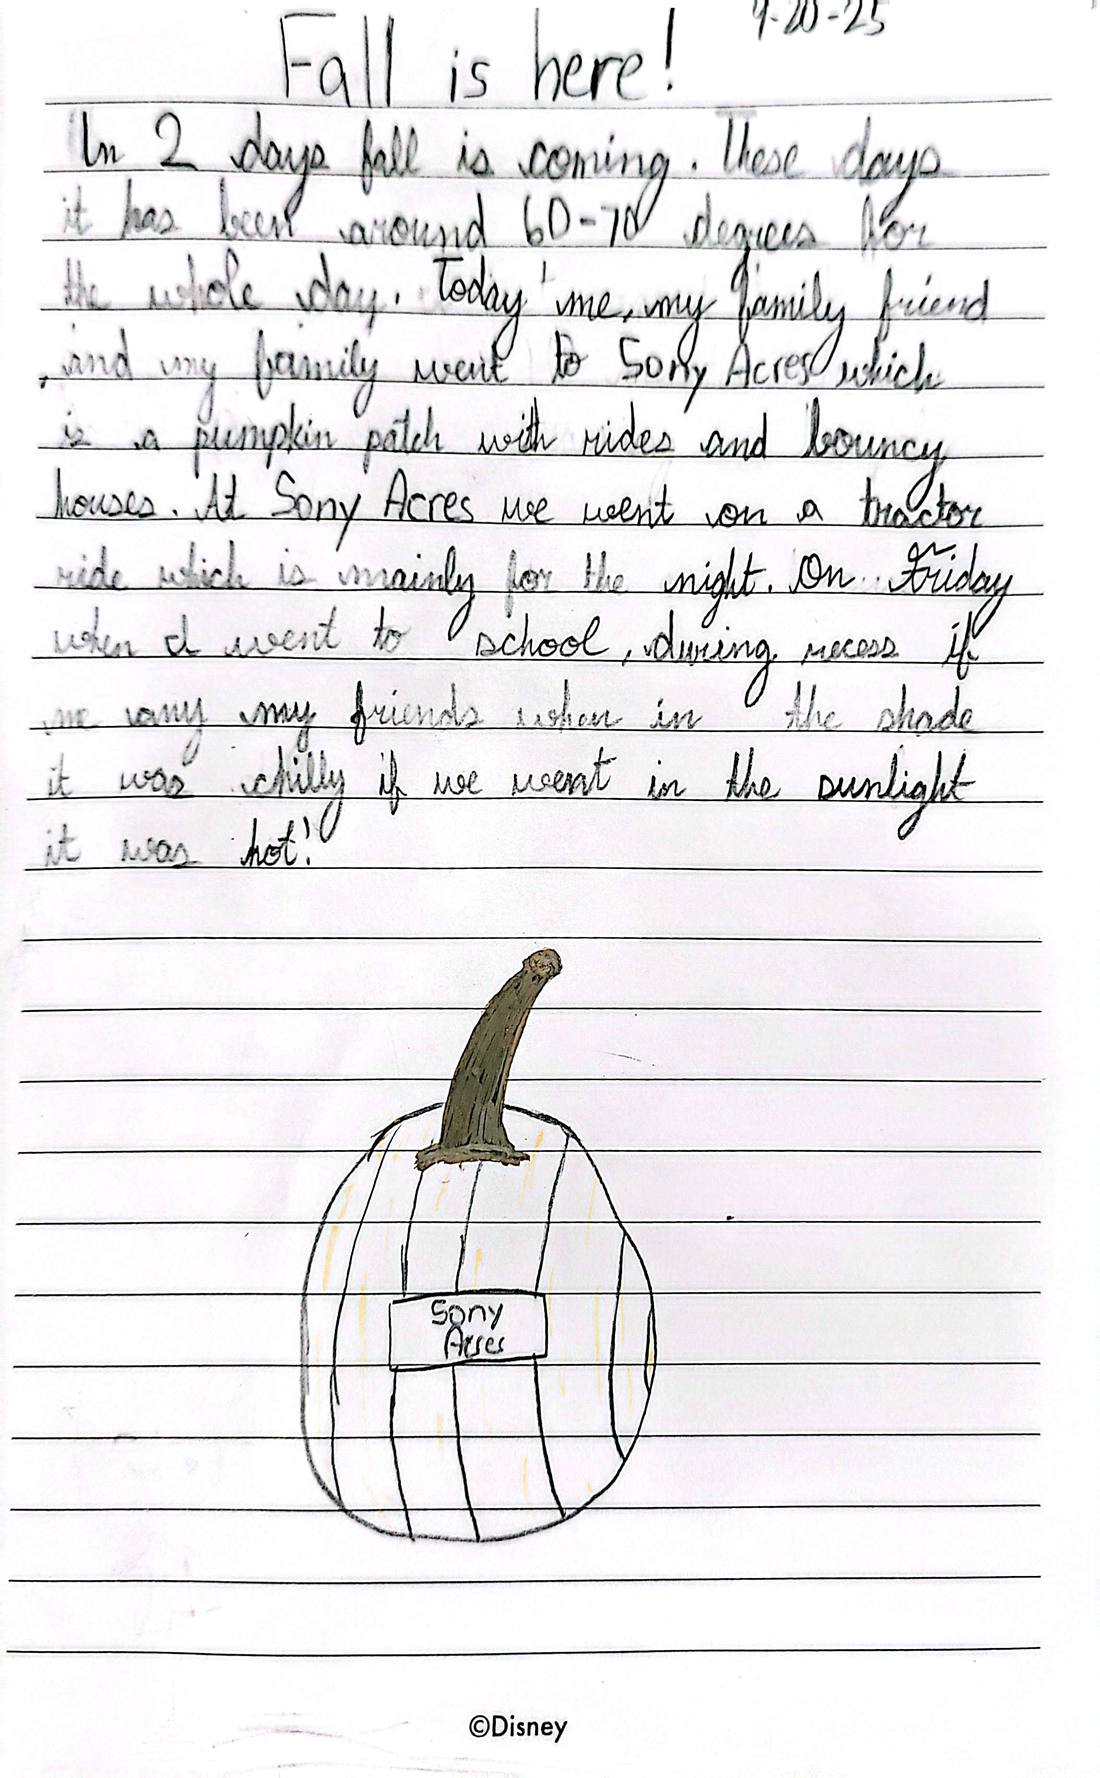
Fall 2025 9 pages
Drawings & photos
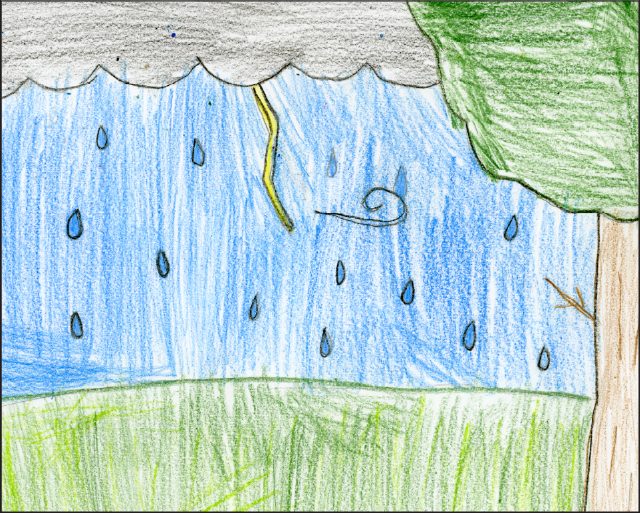
A rainy day
Drawn two days after a storm dropped 1.41 inches of rain on Aug 16.
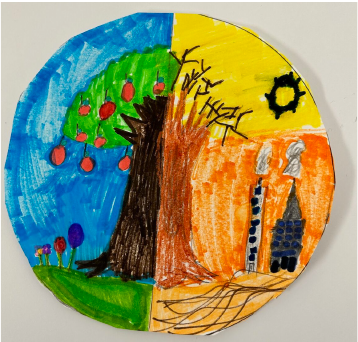
Two visions of Earth
A green Earth, and one hurt by heat and pollution.
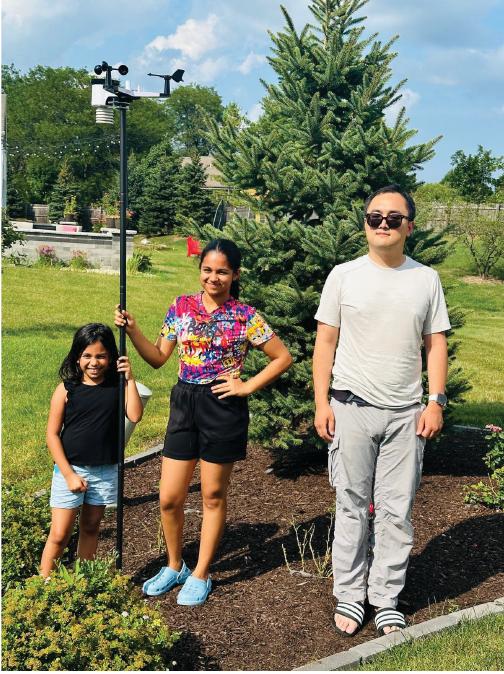
Setting up the station
The backyard station that measured every day above.
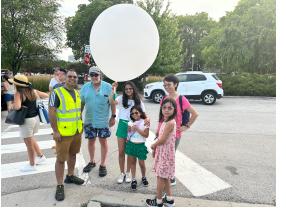
Weather balloon launch
A CROCUS weather-balloon activity at Chicago’s Field Museum.
From our science poster
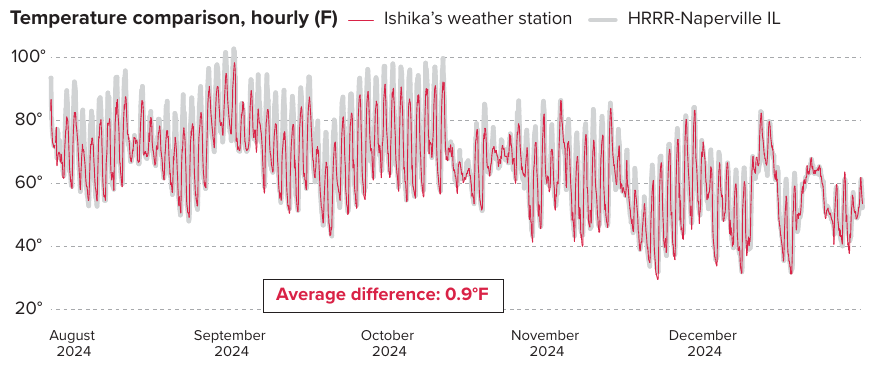
How we got these numbers
The station took a reading every 5 minutes. Each day’s high, low and average come from those readings. Days without enough readings are left blank, and wind is left blank on days the wind sensor recorded nothing.
After Feb 22, 2025 the station only saved about one reading a day, at different times, so those days aren’t shown. Live readings are not connected to this website.